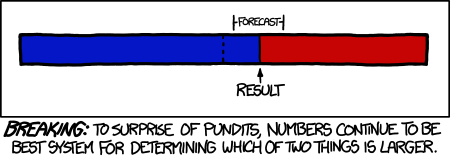

I have wanted to write about the growing importance of big data and analytics for a while, but this is a tech site and I did not want to get it embroiled in the political tempests. But now that the votes have been counted, we have a stunning demonstration of the power of data, as suggested by the XKCD cartoon above.
In the closing days of the campaign, New York Times blogger Nate Silver emerged as a lightening rod. He drew fire from both Republicans and traditional pundits of all stripes for his insistence that despite the closeness of the polls, both nationally and in key states, that President Obama was an overwhelming favorite to win re-election by a narrow margin in the popular vote and a much larger one in the electoral college. He was, of course, dead on.
People who are now hailing Silver as the greatest political pundit ever are completely missing the point, because Silver’s approach was about as far as you can get from the seat-of-the-pants, anecdotal methods of pundits. He went with the data.
Silver’s best friend was something known to mathematicians and statisticians as the law of large numbers. What this theorem, first developed in the 18th century, says is that as you take many samples some some phenomenon, say the percentage of voters supporting Obama in Ohio, the results of these tests will cluster around the true value. (The law’s cousin, the central limit theorem, allows much great specificity about the nature of that clustering, but also is subject to much more stringent restrictions.)
Pundits kept focusing on individual polls and the fact that the difference fell within the margin of error.* Silver understood that as you used more and more polls, the probable error of the aggregated result shrank. In other words (and very roughly) if 10 polls each show Candidate A with a one point lead, you can be reasonably confident that A is in the lead even though the error of each poll is plus or minus three points.
Silver also used a tool that gave him a way to quantify predictions. Now a model necessarily involves making a lot of assumptions. For example, Silver’s novel (which he has been reasonably transparent about, though he has never released its detailed specification) assigned a fairly heavy weight to key economic indicators early in the campaign, but reduced the weight as time went on based on the assumption that new data have less effect as election day nears. It also involves weighting the influence of polls based on their track record and “house effect” (a tendency to favor on party or candidate relative to other polls. He then used to model to run thousands of daily simulations of possible outcomes, a sort of Monte Carlo method. His probability of victory on any given day was simply the percentage of simulations in which a candidate emerged as the winner.
This sort of analysis has only recently become possible. First, we didn’t have the raw data. There were fewer polls, and greater lags between the collection of data and its release. Second, until the recent massive increases in cheap and available computing power, doing thousands of daily runs of a model of any complexity was impossible. A similar phenomenon lies behind the increased accuracy of weather forecasts, including the extremely accurate predictions of the course and effects of Hurricane Sandy. Weather forecasters use supercomputers for their simulations because the models are far more complex, but the techniques and the beenfits are much the same.
Too bad we don’t have more data-driven analysis in tech. Of course, there’s the big problem that a lot of the necessary data just isn’t available. Only Apple, Amazon, and Samsung know exactly how many of which products they sell, and they are not inclined to share the information. Still, there are analysts who make the most of the data. Two who come to mind are Horace Dediu of Asymco, who keeps tabs on the handset business, and Mary Meeker of Kleiner Perkins, who provides infrequent but deep data dives. We could badly use more data and less posturing.
—
*–Poll margin of error is one of the most misunderstood concepts around. First of all, the term should be abandoned. The correct concept is a confidence interval; what you are saying when you claim a margin of error is plus or minus three points is that some percentage of the time (the confidence level, typically 95% in polling) the actual result wii be within three points of the reported value. Pollster should act more like engineers and surround their point values with error bars. Second, the size of the confidence interval is purely a function of the sample size and says nothing whatever about how well a poll is executed. So a poll with poorly put questions and a badly drawn but large sample will have a tighter confidence interval than a much better done poll with a smaller sample.