Wearables Gain Momentum

Perhaps the most surprising part of Apple’s earnings for many was the clarity for Apple Watch, with Apple stating sales had doubled year-over-year. Perhaps more interestingly, Tim Cook explained Apple Watch sales doubled in six of the top ten markets where it is sold.

What makes this worth paying attention to is the bump came in a non-holiday quarter. Many of us in the analyst community who study this market have been adjusting our models to reflect what vendors and retailers are telling us about wearables — they are increasingly becoming holiday season product cycles. Digging into what happened this quarter an interesting insight emerges. After speaking with many retailers and looking at the earnings and company narratives from Fitbit and Garmin, it is clear fitness trackers had a pretty bad first quarter.

This chart looks at Fitbit and Apple Watch sales for the past few years:

Speaking with retailers specifically, Fitbit has been the bellwether for the state of the fitness tracker market. It appears, at least with all available data we have at the moment, the fitness tracker market has been struggling. Even Garmin reported revenue declines of 3% in the fitness segment of their business. Garmin attributed this to the rapidly maturing market dynamics of the fitness segment. So both Fitbit and Garmin were down in their health/fitness segment but Apple Watch doubled? Something else must be going on in the market. I have two theories.

The first is Fitbit has served as a feeder for Apple Watch. This has been a thesis we have held ever since Apple Watch entered the market but have not had any data from the past few years to quantify it. The thesis is, a consumer buys a basic fitness tracker like a Fitbit, owns it for a year or so and validates there is value with a wrist-based device but wants more than what a basic fitness tracker offers so they opt for a smartwatch, in this case, an Apple Watch. We had shades of this thesis playing out at the end of last year as this was the path of Fitbit Blaze owners who moved up to Fitbit’s smartwatch from their basic fitness tracker. If we are looking at this just from a fitness perspective, it is possible consumers who were previous Fitbit owners, and established value with the idea, graduated up to an Apple Watch. This is why it may not be coincidence Apple Watch sales eclipsed Fitbit’s in a quarter for the first time.

The second theory is the market is moving beyond fitness. It’s possible consumers are starting to see the appeal of Apple Watch beyond fitness and more for the functionality. Not to say the fitness part isn’t important but perhaps it is not the single largest factor driving sales any longer. Apple Watch has also gained quite a bit of momentum and is starting to show up in greater volume in more markets. Perhaps the Apple Watch has proved itself to the skeptics now that they see the product on more people more often in public. Therefore, Apple is starting to gain the interest of people who once expressed none in the category. The continued marketing campaigns may have helped as well but there could be a snowball effect starting to happen with Apple Watch.

We know customer satisfaction remains high for Apple Watch so it stands to reason, as more and more people (roughly 25-30 million consumers) start telling others how much they love the product and find value in what it does that, at some point, we could/should see a tipping point. Perhaps that time is now.

Of course, we would need a few more quarters of sales to see which of these theories is playing out. 2017, in my mind, has now become somewhat of a defining year for this category to see if it can break out beyond fitness. Granted, we estimate the total market size globally for just a fitness-centric wearable to be between 200-300 million, still a decent market size. Ultimately, we are still bullish on the value but the upside will ideally go beyond health and fitness. That remains the story to watch.

Smartphone Brand Stories in China

China is an incredibly important market for the global technology industry. It is also a fascinating one to study because, more often than not, the market as a whole is an anomaly. So we often see things that happen and work in China that do not provide applicable lessons for the broader technology market as a whole. One continual example of this reality is the smartphone market in China. Brands can seemingly come out of nowhere, sell tens of millions of phones in a year, then fizzle out. The technology battle that happens in China is very often one centered around brands. Chinese consumers are some of the most brand conscious in the world. It’s a fundamental idea to understand why Apple has had continued success in the region.

I decided it would be interesting to make a few observations on the Chinese market and the story of a few specific smartphone brands.
Take a look at this chart. I’ve shown the percentage of a few name brands in China and their presence by accessing a mix of Chinese apps and cellular network activity.

The data is collected from hundreds of millions of devices accessing developer tool kits provided by companies like Baidu (one of the standards for app development and analytics for Chinese developers). I see the analytics reports for all three major developer toolkits and have triangulated between them to make sure the above chart is consistent. The other point to note is this includes tablet traffic so, in the case of Apple’s share, it is what total iOS share makes about the analytics.

On the point of Apple, what you notice is the fairly consistent 30% device share using these metrics. The analytics data breaks down this data by device model for developers. They know what screen sizes, resolution, network capabilities, etc., have the majority share so they can is use their resources wisely. This is one reason so many developers in China continue to focus on iOS. Not only are Apple devices ~30% share of the market opportunity for them but Apple provides both better economic incentives for these developers (since they can make more money on iOS) but Apple also offers them far fewer hardware variables than the open ocean of Android devices that exist in China. A simple look at this data by any developer and it’s clear where your best software opportunity lies. Interestingly, the ~30% presence of iOS devices is pretty consistent with actual installed base estimates of iOS in China which we are confident is in the 30-35% range or about 280m iOS devices in total in use in China.

Samsung’s Decline
Perhaps the biggest storyline to me is Samsung’s decline in China. Before the smartphone era, and even into the beginning of it, Samsung was a dominant brand in China. Local brands becoming dominant in China is a relatively new phenomenon because, for a long time, Chinese consumers felt Chinese brands were not up to the quality of foreign brands and no one wanted to risk spending their hard earned money on a brand that could be lower quality. For this reason, Chinese consumers tended to purchase brands they were familiar with and knew were quality. Samsung was in that class. The other point to note here on Samsung is while their brand was viewed as reliable and high quality, it was also not playing in the high-end in China but competed with much more affordable, somewhat low-end devices on the price spectrum. This, I believe is the singular reason for their decline.

Apple has never competed on price in China. It kept them in a class unto themselves from a brand standpoint. Samsung’s strategy to compete on price and be affordable for a majority of Chinese consumers left them vulnerable once Chinese brands gained in recognition and were the same price or lower than Samsung. Perhaps a law of consumer electronics has emerged. Start by competing on price, and you will always compete on price. This is why we do not see brands that start in the low-end affordable market succeed in the high-end premium market.

Huawei’s Steady Climb
What impresses me most about Huawei’s growth in China is how remarkably steady their line is compared to other Android brands. This, I would argue, is the sign of a stable strategy in China and one that suggests to me they are not a “flash in the pan” story that grows fast and falls like other brands in the region.

The vast majority of data points we see on Huawei shows a continued rise in loyalty of buyers to repurchase a Huawei phone, not something we see of other Android brands in China. We also see the Huawei brand being one consumer are expressing a sentiment that they believe Huawei is innovative and, in some cases, Chinese consumers say as innovative as Apple. Also something that was not true a few years ago.

Huawei remains the brand to keep an eye on and, as I’ve said before, they are likely going to take over Samsung in many markets. I would not be surprised if, some day, Huawei takes Samsung’s place as the leader in smartphones sales worldwide.

Shooting Stars
Lastly, I want to point out the swap in places of Oppo and Xiaomi. Xiaomi was the solid number three brand in China, receiving all kinds of press, attention, and local love for their flare. Now, their trendline is in decline with no signs of recovery and Oppo is emerging as the clear number three brand with Vivo hard on its heels. It is notable Vivo and Oppo are a part of the same larger electronics company in China called BBK. If you look closely at the chart, BBK used to be a smartphone brand with Vivo as a sub-brand. Somewhere around the end of 2015, they decided to shift focus from the BBK brand to Vivo. Knowing this, if we add up the brand share of Oppo and Vivo, it comes out to 17.44% which means BBK devices as a whole would be the number two share leader in China above Huawei. This dual brand strategy of BBK is one to watch and the dynamic between these two brands, which can focus and compete in different areas independently, could cause Huawei some troubles they have not yet anticipated.

That being said, shooting stars in China can rise and fall quickly. It is important to not just look at who has the most sales share or a flashy sales data point and look at who is developing sustainable growth strategies that have worked over time, not just for one quarter. That is the broader story this chart tells.

Smartphone Brand Repurchase Intention

As I’ve said before, the global smartphone sales race is establishing the global consumer tech brands to fuel the next decade. When we talked about global consumer technology brands in the past, companies like Samsung, Apple, LG, and Sony were in the spotlight. Out of those, only Samsung and Apple are left with companies like Huawei solidifying themselves in the discussion and others like Xiaomi, Oppo and, to a degree, Vivo, trying to get there. Smartphones are the entry point for the next big tech brands and, while most can make a healthy living staying in China, they will not enter the global brand picture unless they can succeed elsewhere. As Huawei attempts to grow in Europe, Africa, and parts of the Middle East, Xiaomi and Oppo are the only other brands we track beginning to make inroads in markets outside of China. Since this is a brand (or future brand) discussion, I think its helpful to see how sticky the brand is when it comes to repurchase intention.

This is likely one of the more global looking brand repurchase intention charts you will see. Most do not cover as many countries as we have access to. However, for the sake of where these brands have some traction, I’ve included a specific list of countries for balance.

The chart depicts top “brands to purchase” as the consumer’s next smartphone. I have charted it out by smartphone owners of said brands. As you can see overall, Apple’s repurchase intent is quite high. As is Samsung’s and Huawei’s when we look at the average across the six countries. You may have seen stats of Samsung’s repurchase rate being high 60% before and we can arrive there when we look at just a few countries. Similar to Apple, it varies quite a bit by specific country when we look just at that country’s responses but, given this is a more developed market look at North America, Western Europe, and China, I think it gives a holistic picture.

When I dig into this data, I’m looking more at how the Android brands are performing and where consumers are looking to go next within Android. Apple seems to maintain a 20-30% range of interest from Android brands any given quarter consistently. Where we see these spikes of intent are as consumer jump from Android brand to Android brand. Looking specifically at this chart, it seems Huawei is poised to gain a lot of customers from Xiaomi and Oppo in the near future, particularly in China. It follows along with the trend we have been seeing with Chinese consumers sentiment toward Huawei continuing to grow. In fact, recent research studies we have read from Mainland China suggest Huawei is coming up on the heels of Apple as a brand local consumers consider most innovative.

From a global perspective, Apple and Samsung are holding relatively steady. The data suggests Huawei is stabilizing as well, thanks to their efforts in recent years since there was a time when their churn was quite bad. Huawei is in a strong third place and the real question is, can any other vendor cross the 100m smartphones sold a year bar? Xiaomi came close, Oppo is nearing Xiaomi’s range with 60-70m per year but that seems to be the ceiling at the moment and largely driven by China alone.

It is worth remembering that pulling off a global brand is exceptionally difficult. Right now, Apple and Samsung are the two that have accomplished this to varying degrees. Apple has maintained a premium global brand status where Samsung has done that in some markets but not all as Apple has. Huawei is using the “affordable premium” strategy and, depending on what other hardware they feel they can tackle, it will be interesting to see how far and wide their brand can go. But, from the data we are seeing, I’m not sure anyone beyond those three is even remotely close to being included in the discussion.

Note on the data: It is not longitundinal which would yield the most accurate repurchase intention, however, I am confident it is directionally accurate.

The Challenges and Opportunities for Apple in 2017

As we head into the new year, I want to embark on a series of posts outlining the key opportunities and challenges facing some of the big names in tech. I’ll continue this over the next few weeks. Given the wave of negativity surrounding Apple at the moment, I thought looking at the key opportunities and challenges the company faces would be a good place to start.

Opportunity

iPhone 8 Super Cycle – Especially in China
Our research indicated that, in developed markets in the West (in particular the US market), we would see a stronger than anticipated upgrade cycle. All the evidence in post-Q4 sales we have seen validates our research. With this research and data in hand, we modeled different scenarios going into 2017 with the iPhone 8 super cycle in mind. The last super cycle came with a form factor change from the 5s to the 6 and 6 Plus. Consensus thinking is the next major form factor change could be another such catalyst.

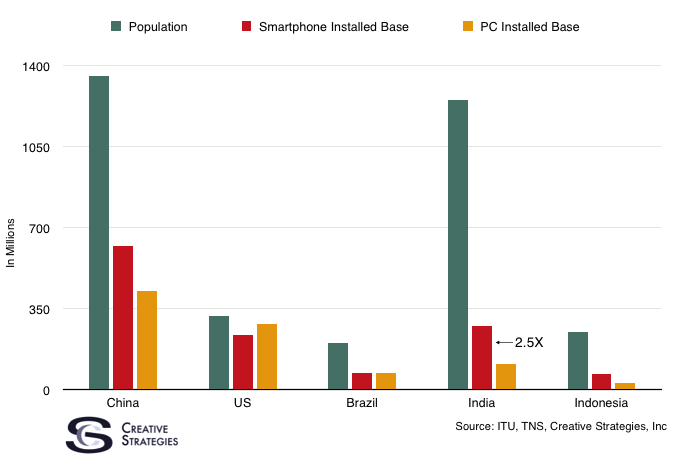
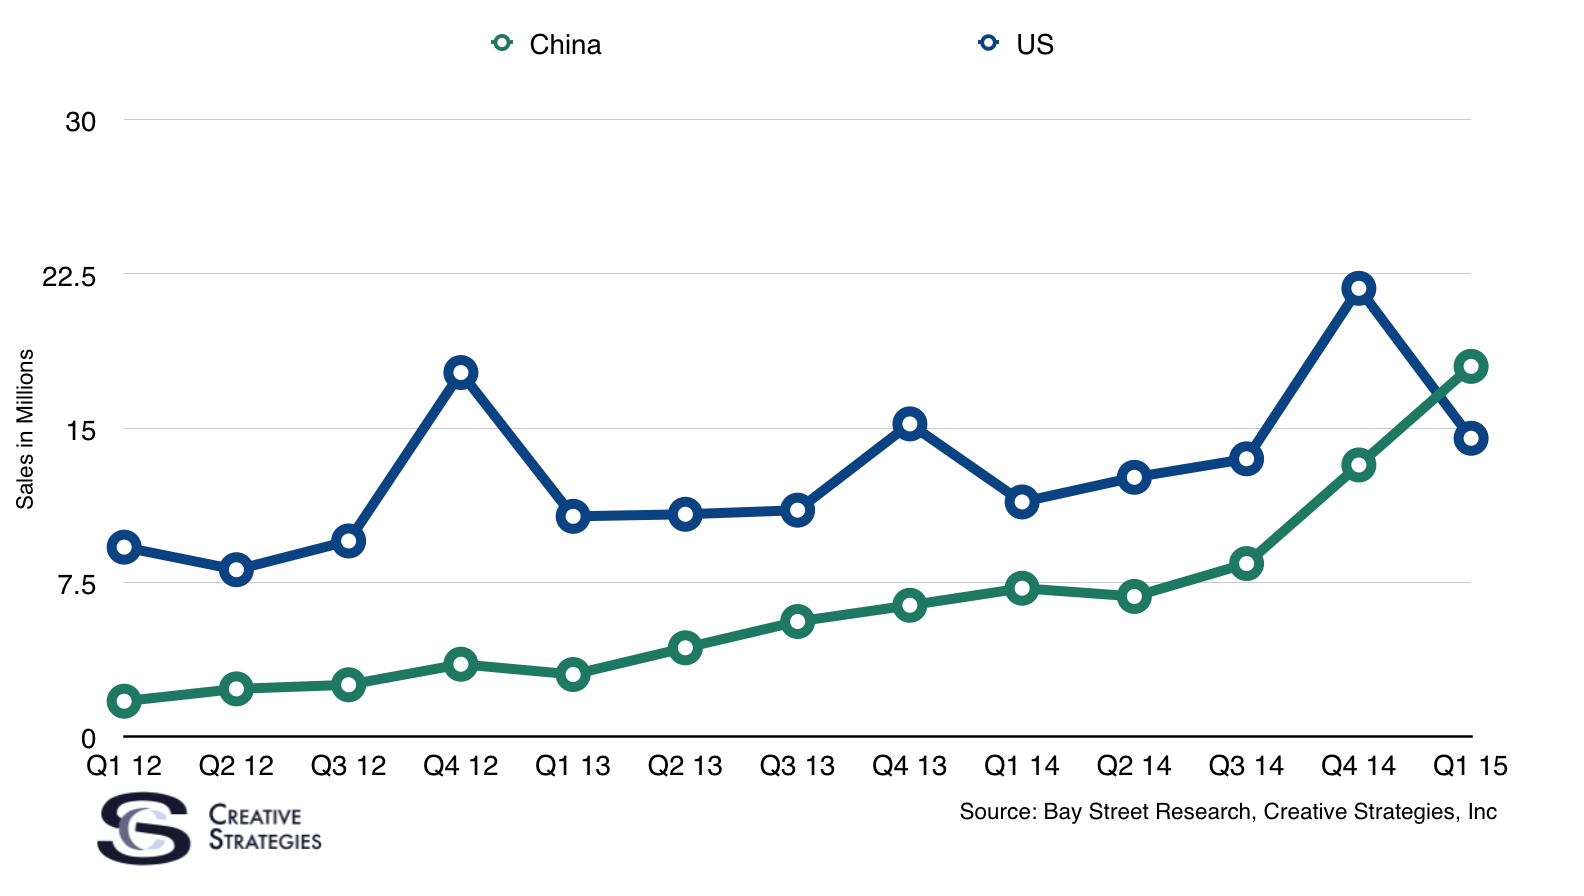
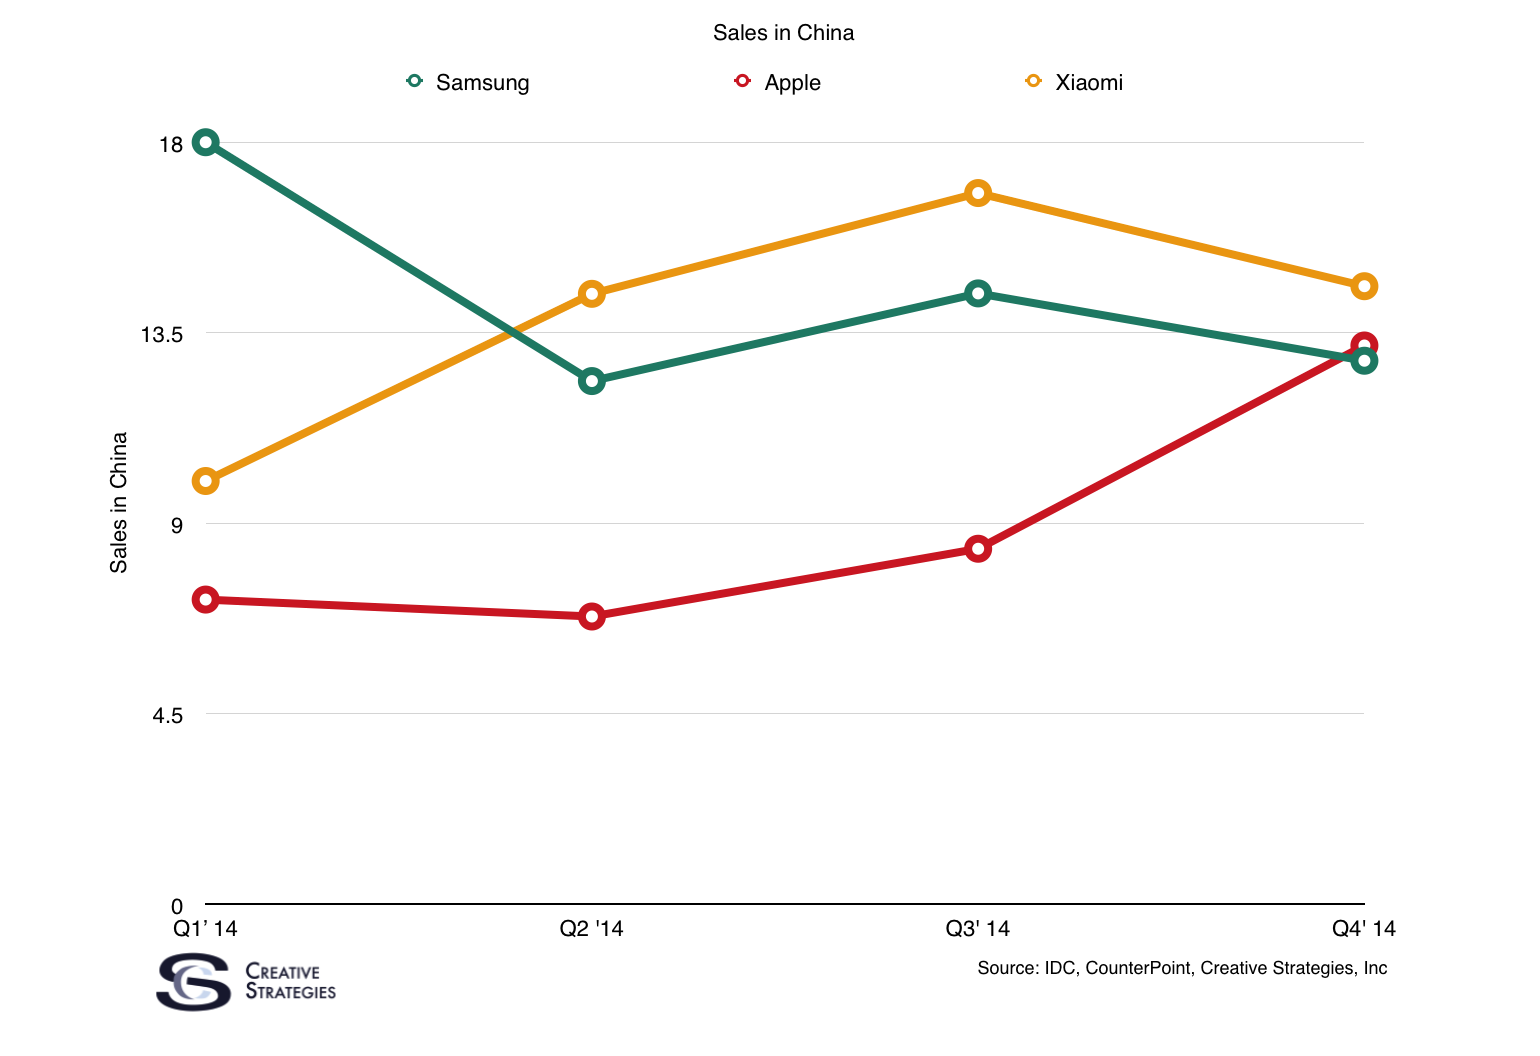
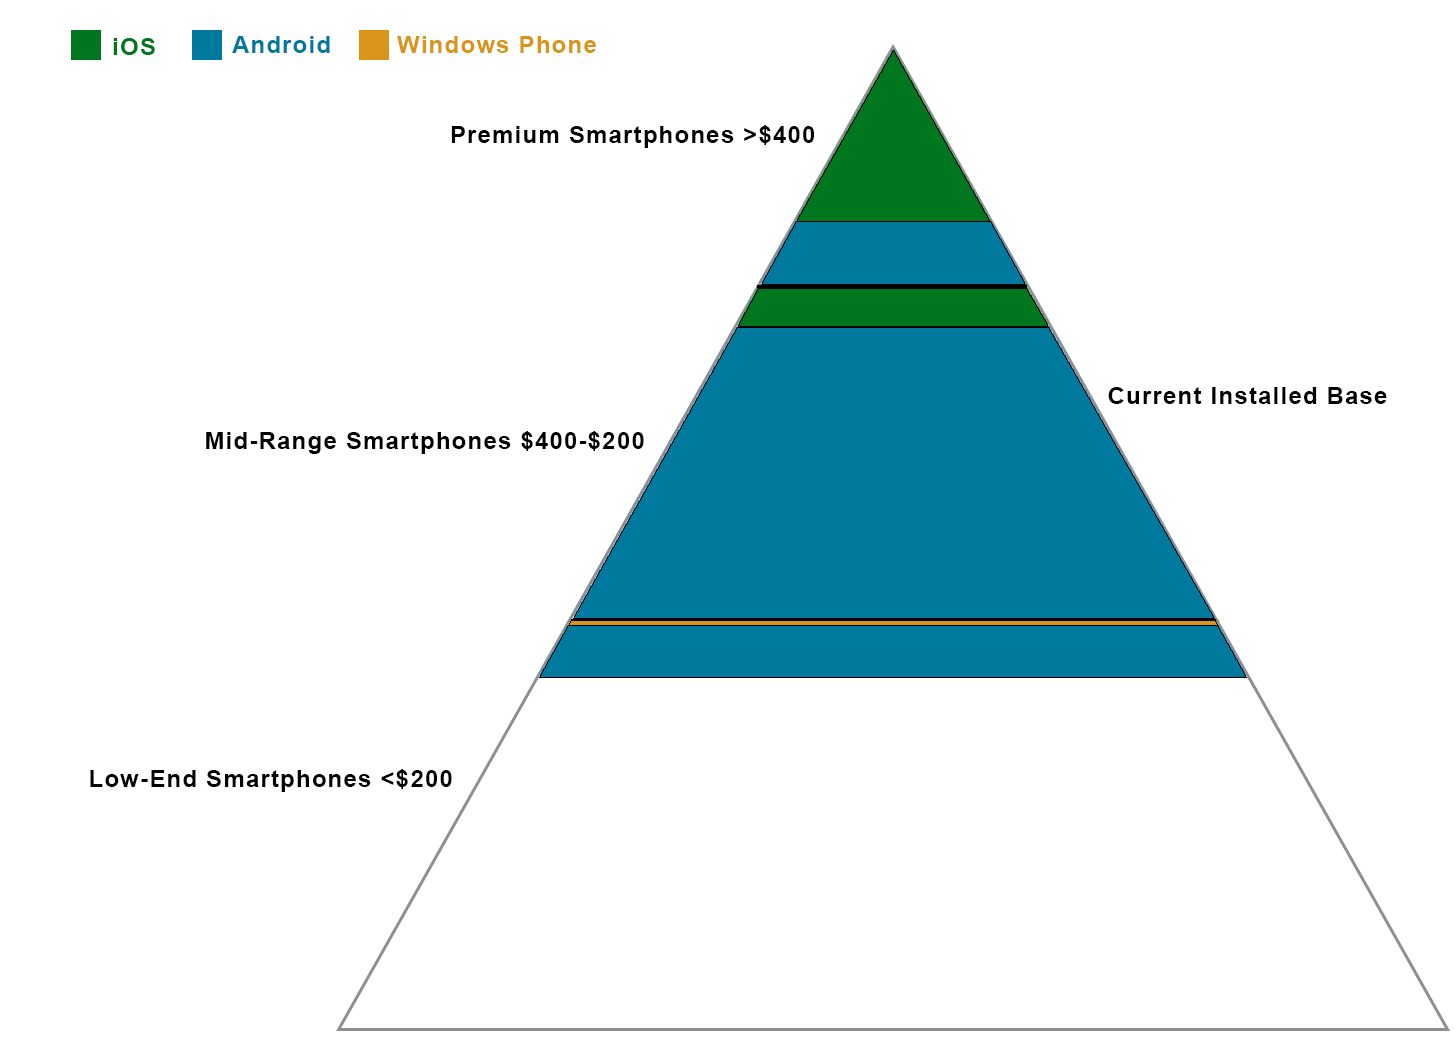
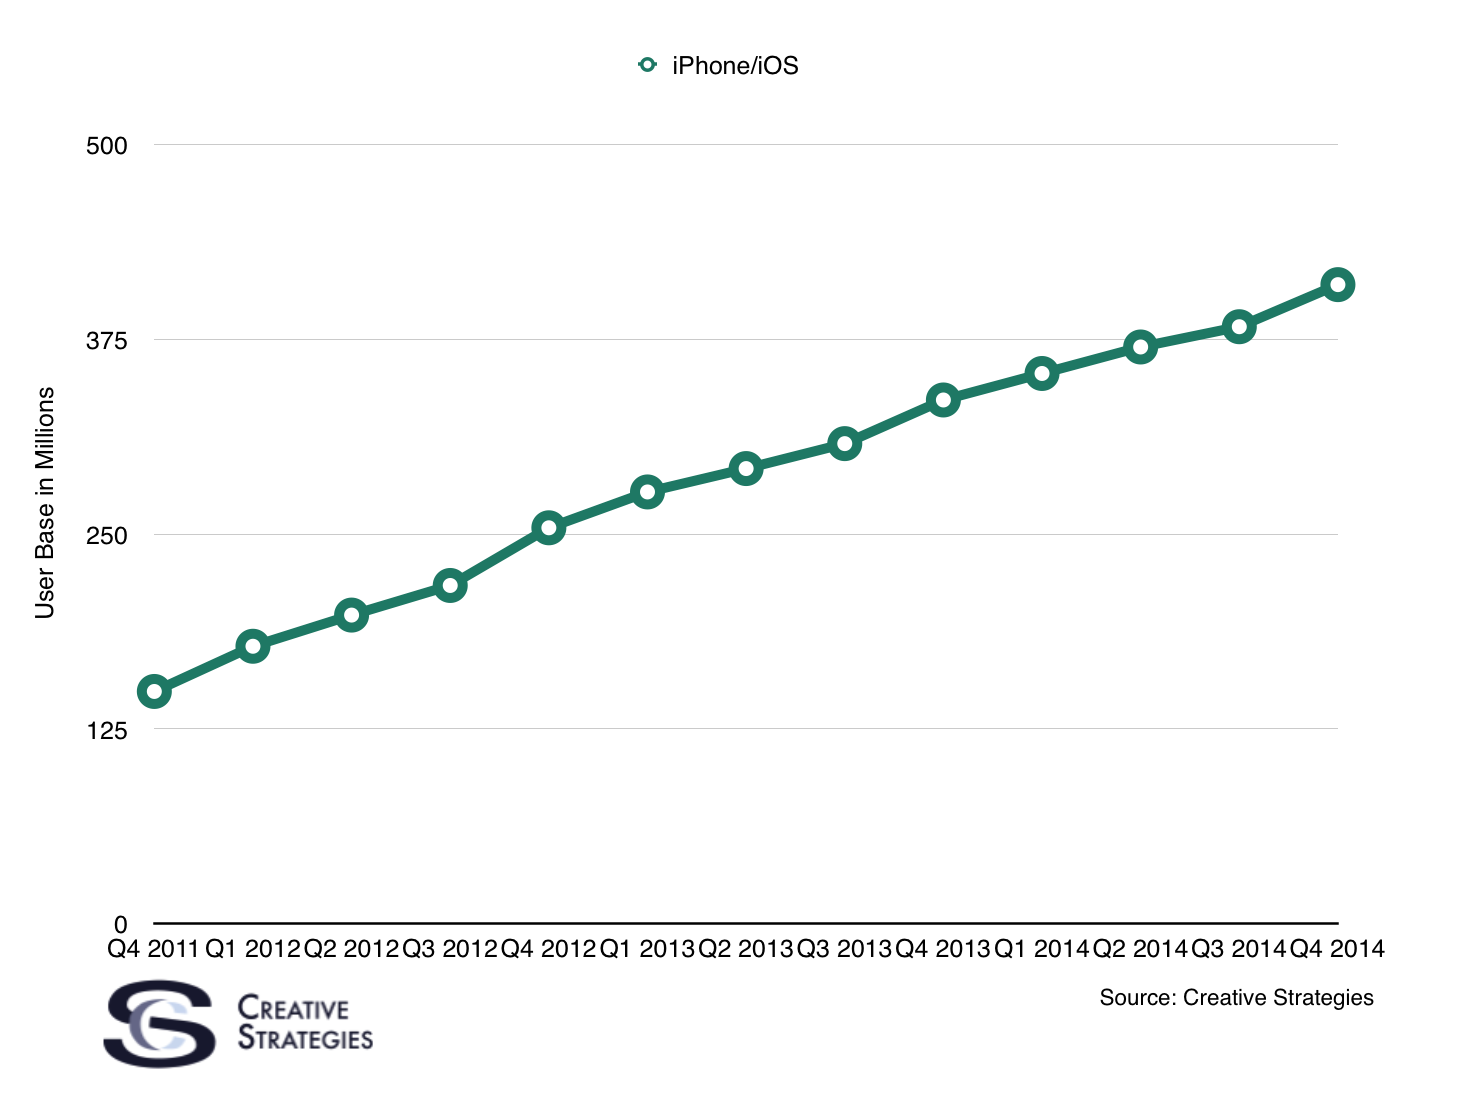
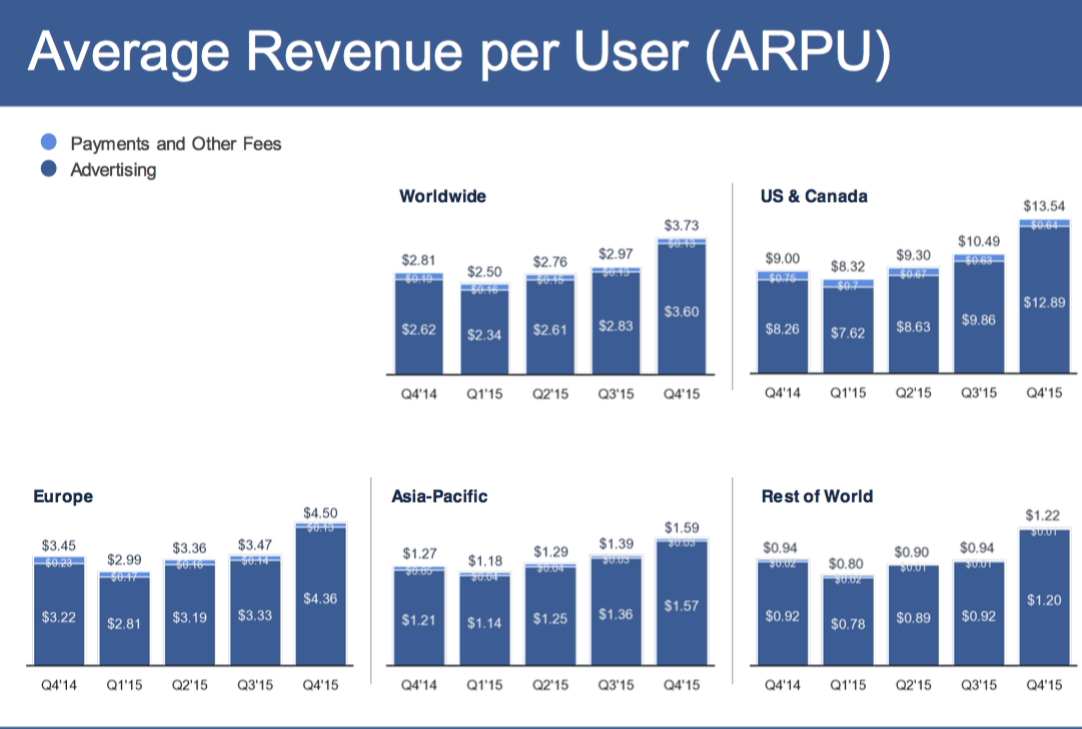
Remember, Apple’s two largest markets by installed base of iPhones is the US and China. These markets combined make up nearly half of the global iPhone installed base. When these markets move, iPhone sales spike. Notably, China has a larger iPhone installed base than the US and it is altogether possible a massive refresh cycle in China alone would spur a super cycle-like sales quarter. And we do believe there is significant pent up demand in China at the moment as a huge chunk of iPhone owners are waiting for something big to come in the iPhone 8.

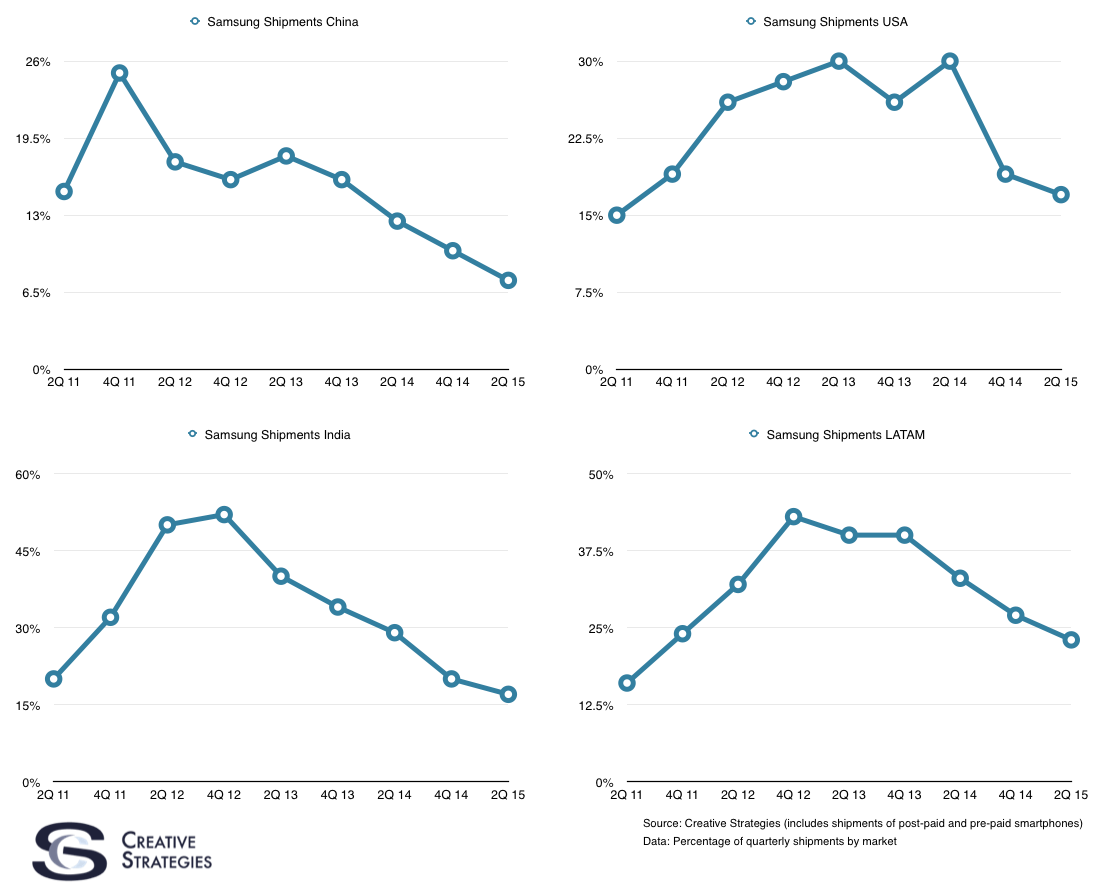
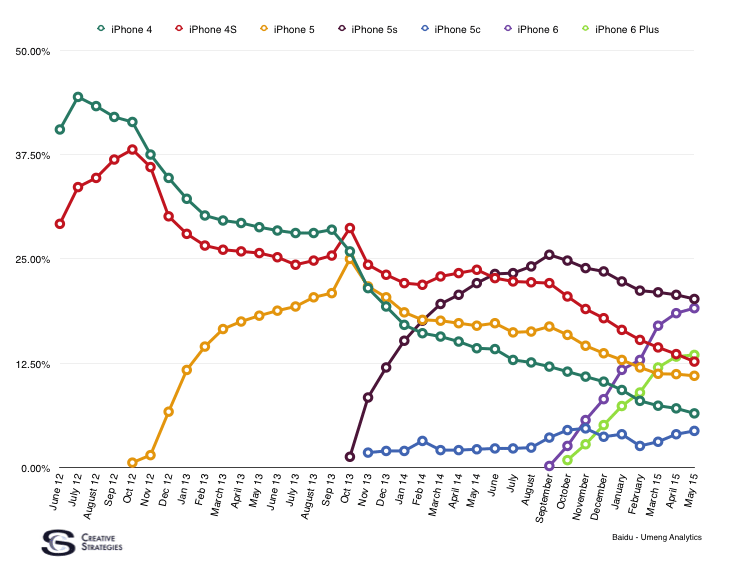
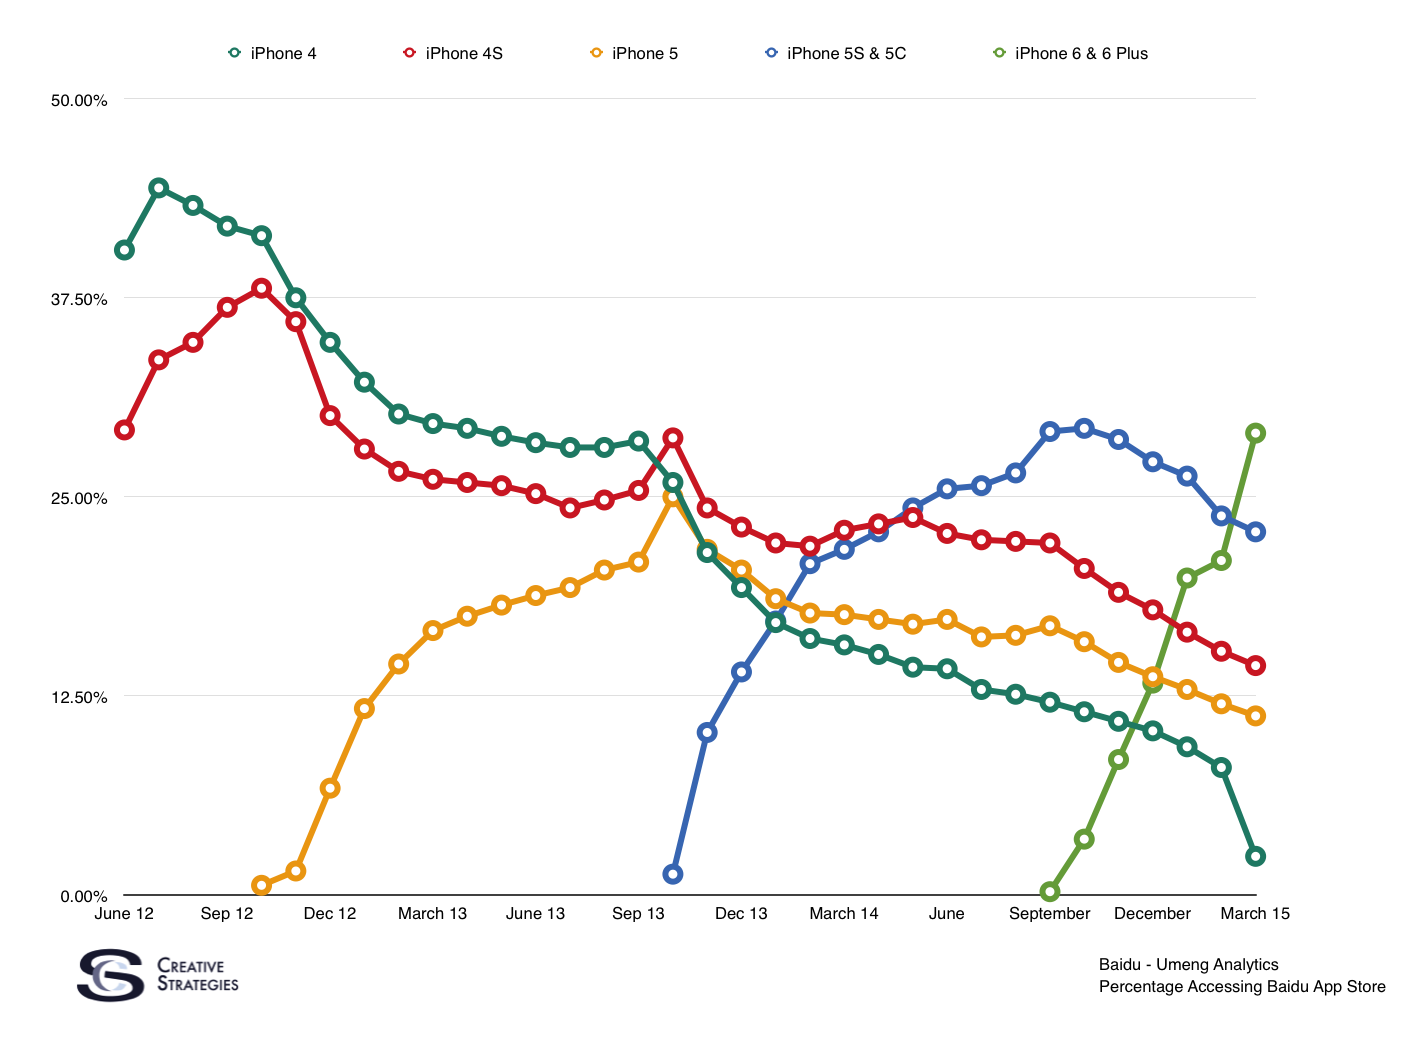
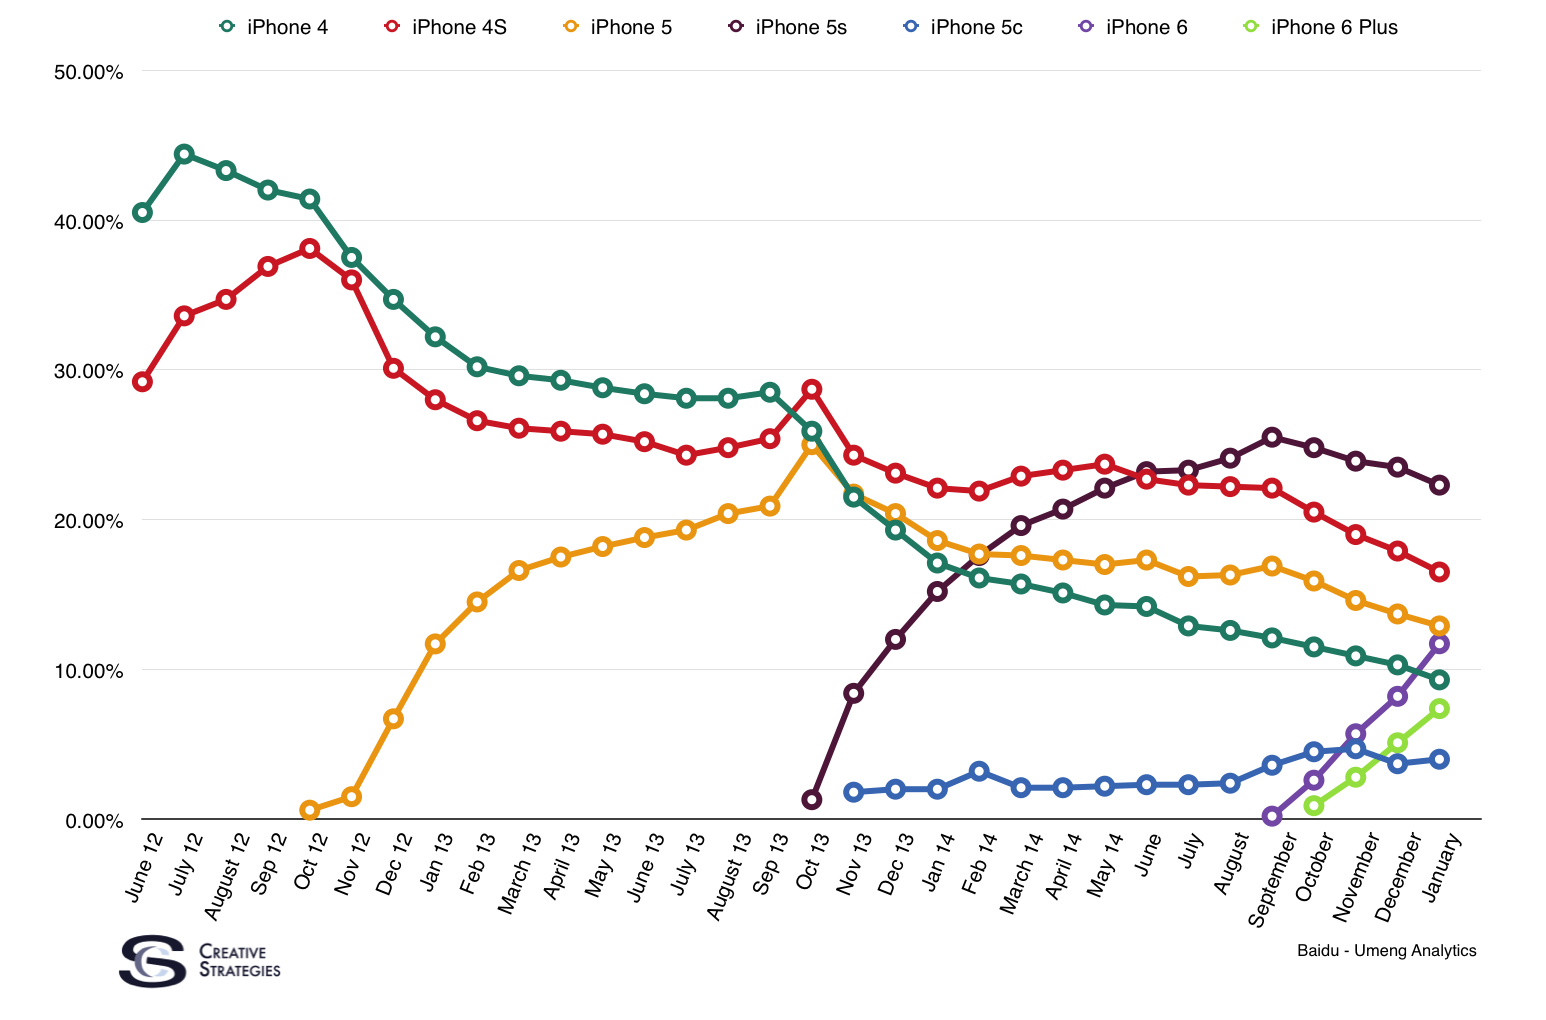
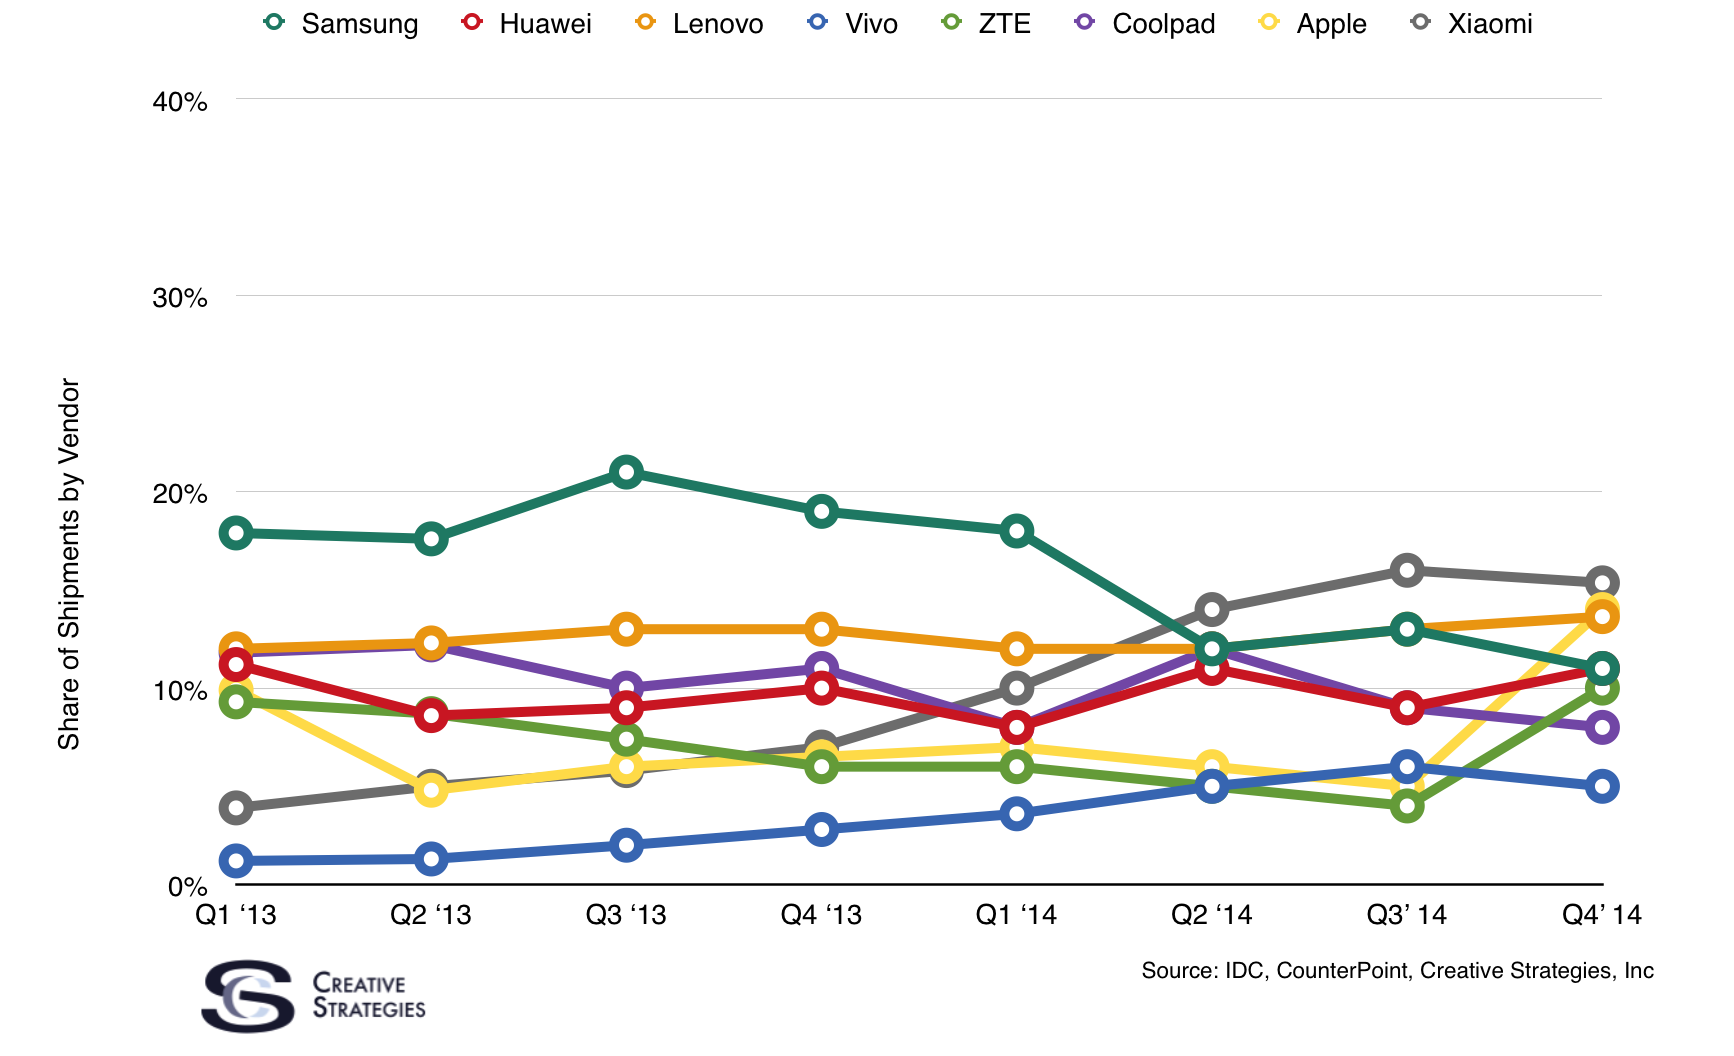
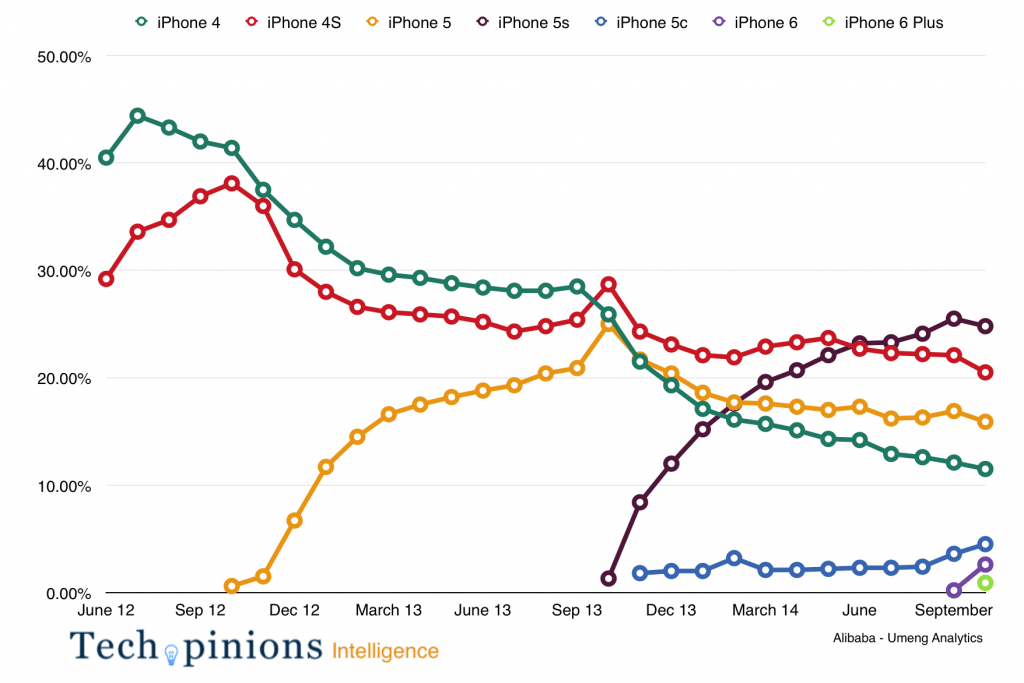
Just looking at the data, Chinese consumers have been holding onto their iPhones longer and longer each year. A good chunk of the Chinese consumer base who jumped into the iPhone family with a 6/6 Plus is still holding onto their devices. The replacement cycle of iPhones went up around 10% from 2015 to 2016 and there is significant evidence Chinese consumers are holding onto their iPhones longer. Per my chart below from active device data in China, we are seeing, for the first time, a mix shift toward the 7 Plus and the reasons have given us a key insight into the Chinese consumer mindset regarding Apple. They will buy whatever is perceived as a significant innovation. It appears the camera in the 7 Plus was enough to cause a mix shift. Which leads me to believe a big form factor change, the addition of OLED, wireless charging, etc., will cause a huge sales cycle in China. Should these things come in the iPhone 8, expect Apple’s sales from China to be significant.

Not to downplay the iPhone 8 opportunity at a global level but we believe the biggest opportunity awaiting Apple in 2017 is the Chinese market with the iPhone 8.

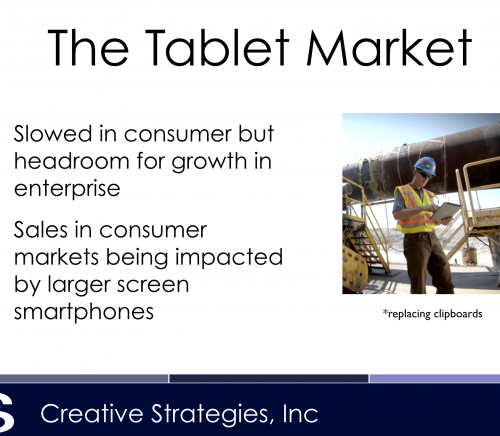
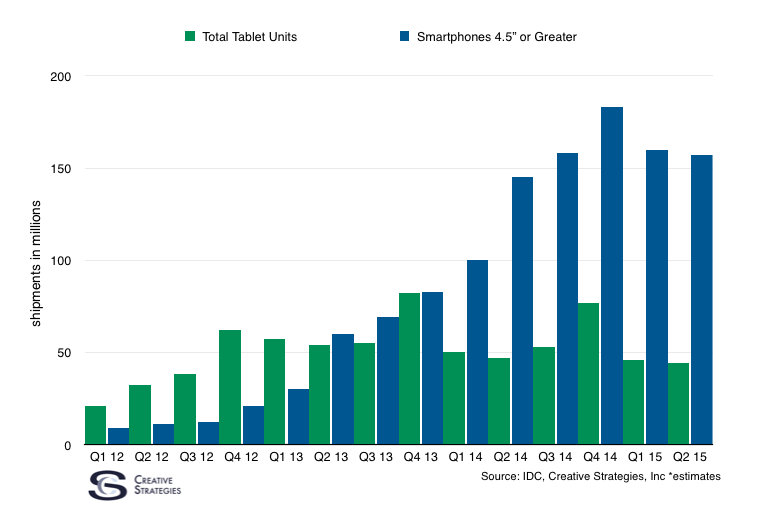
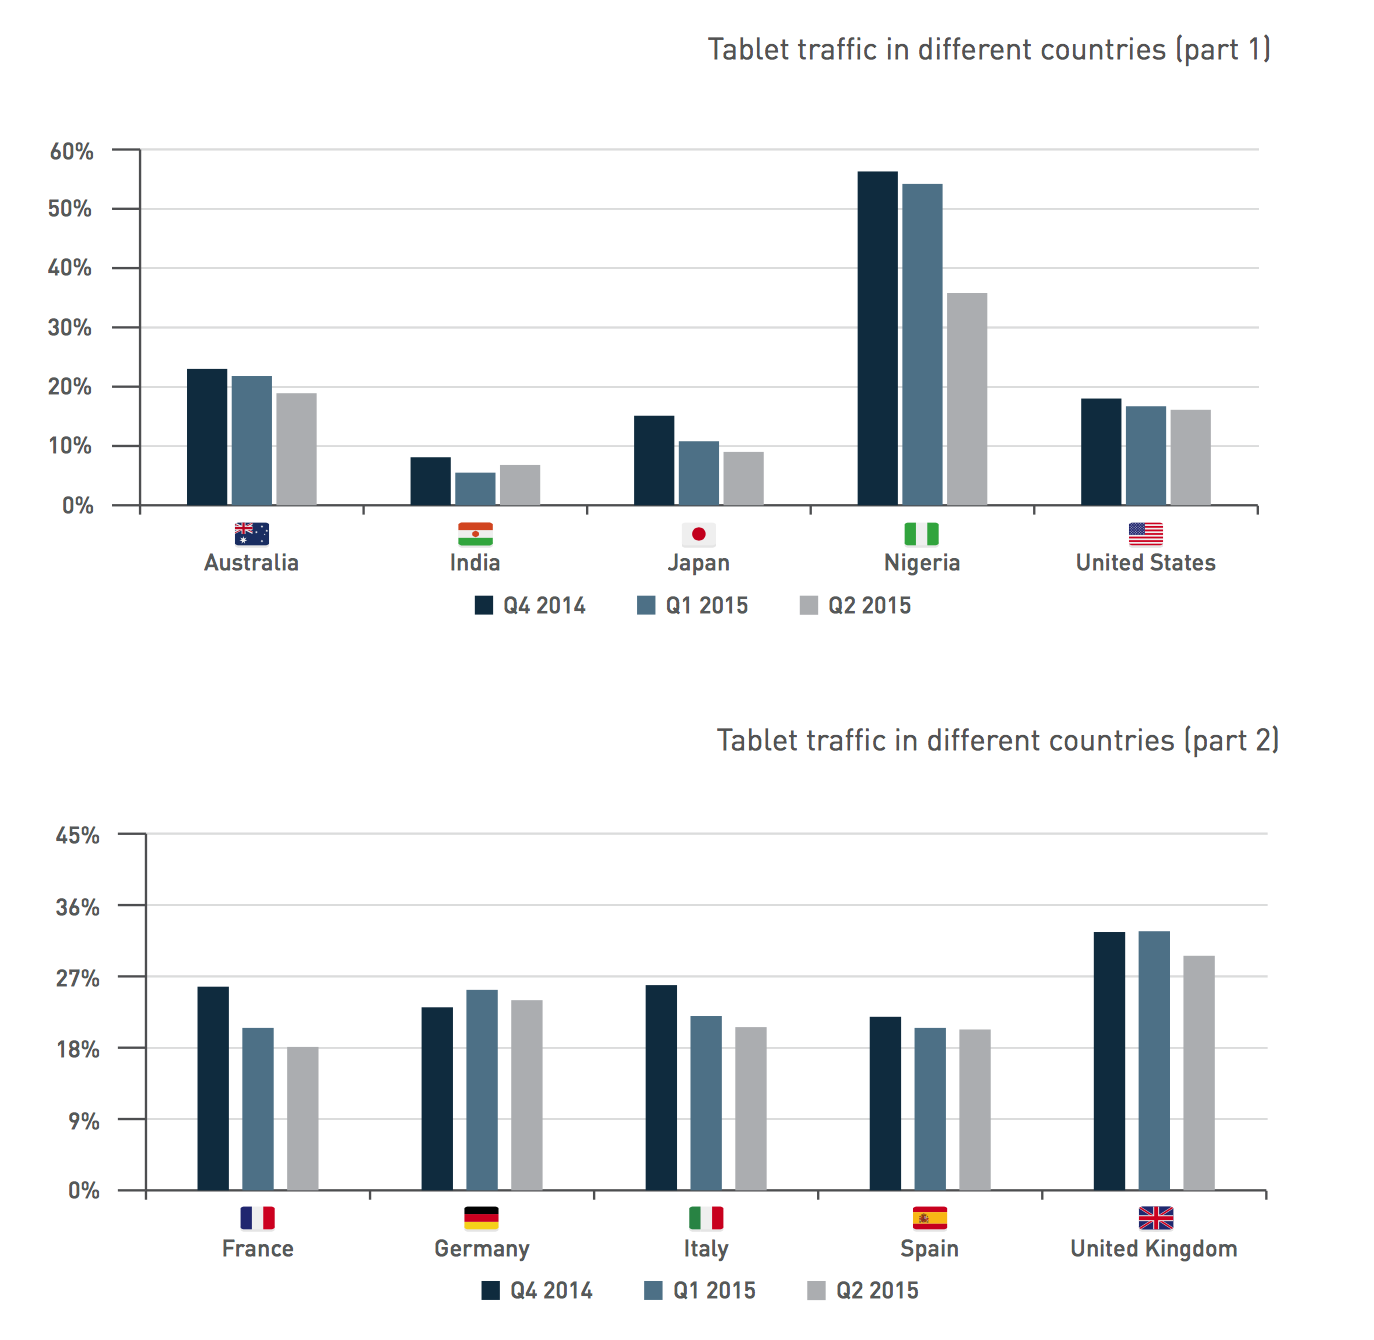
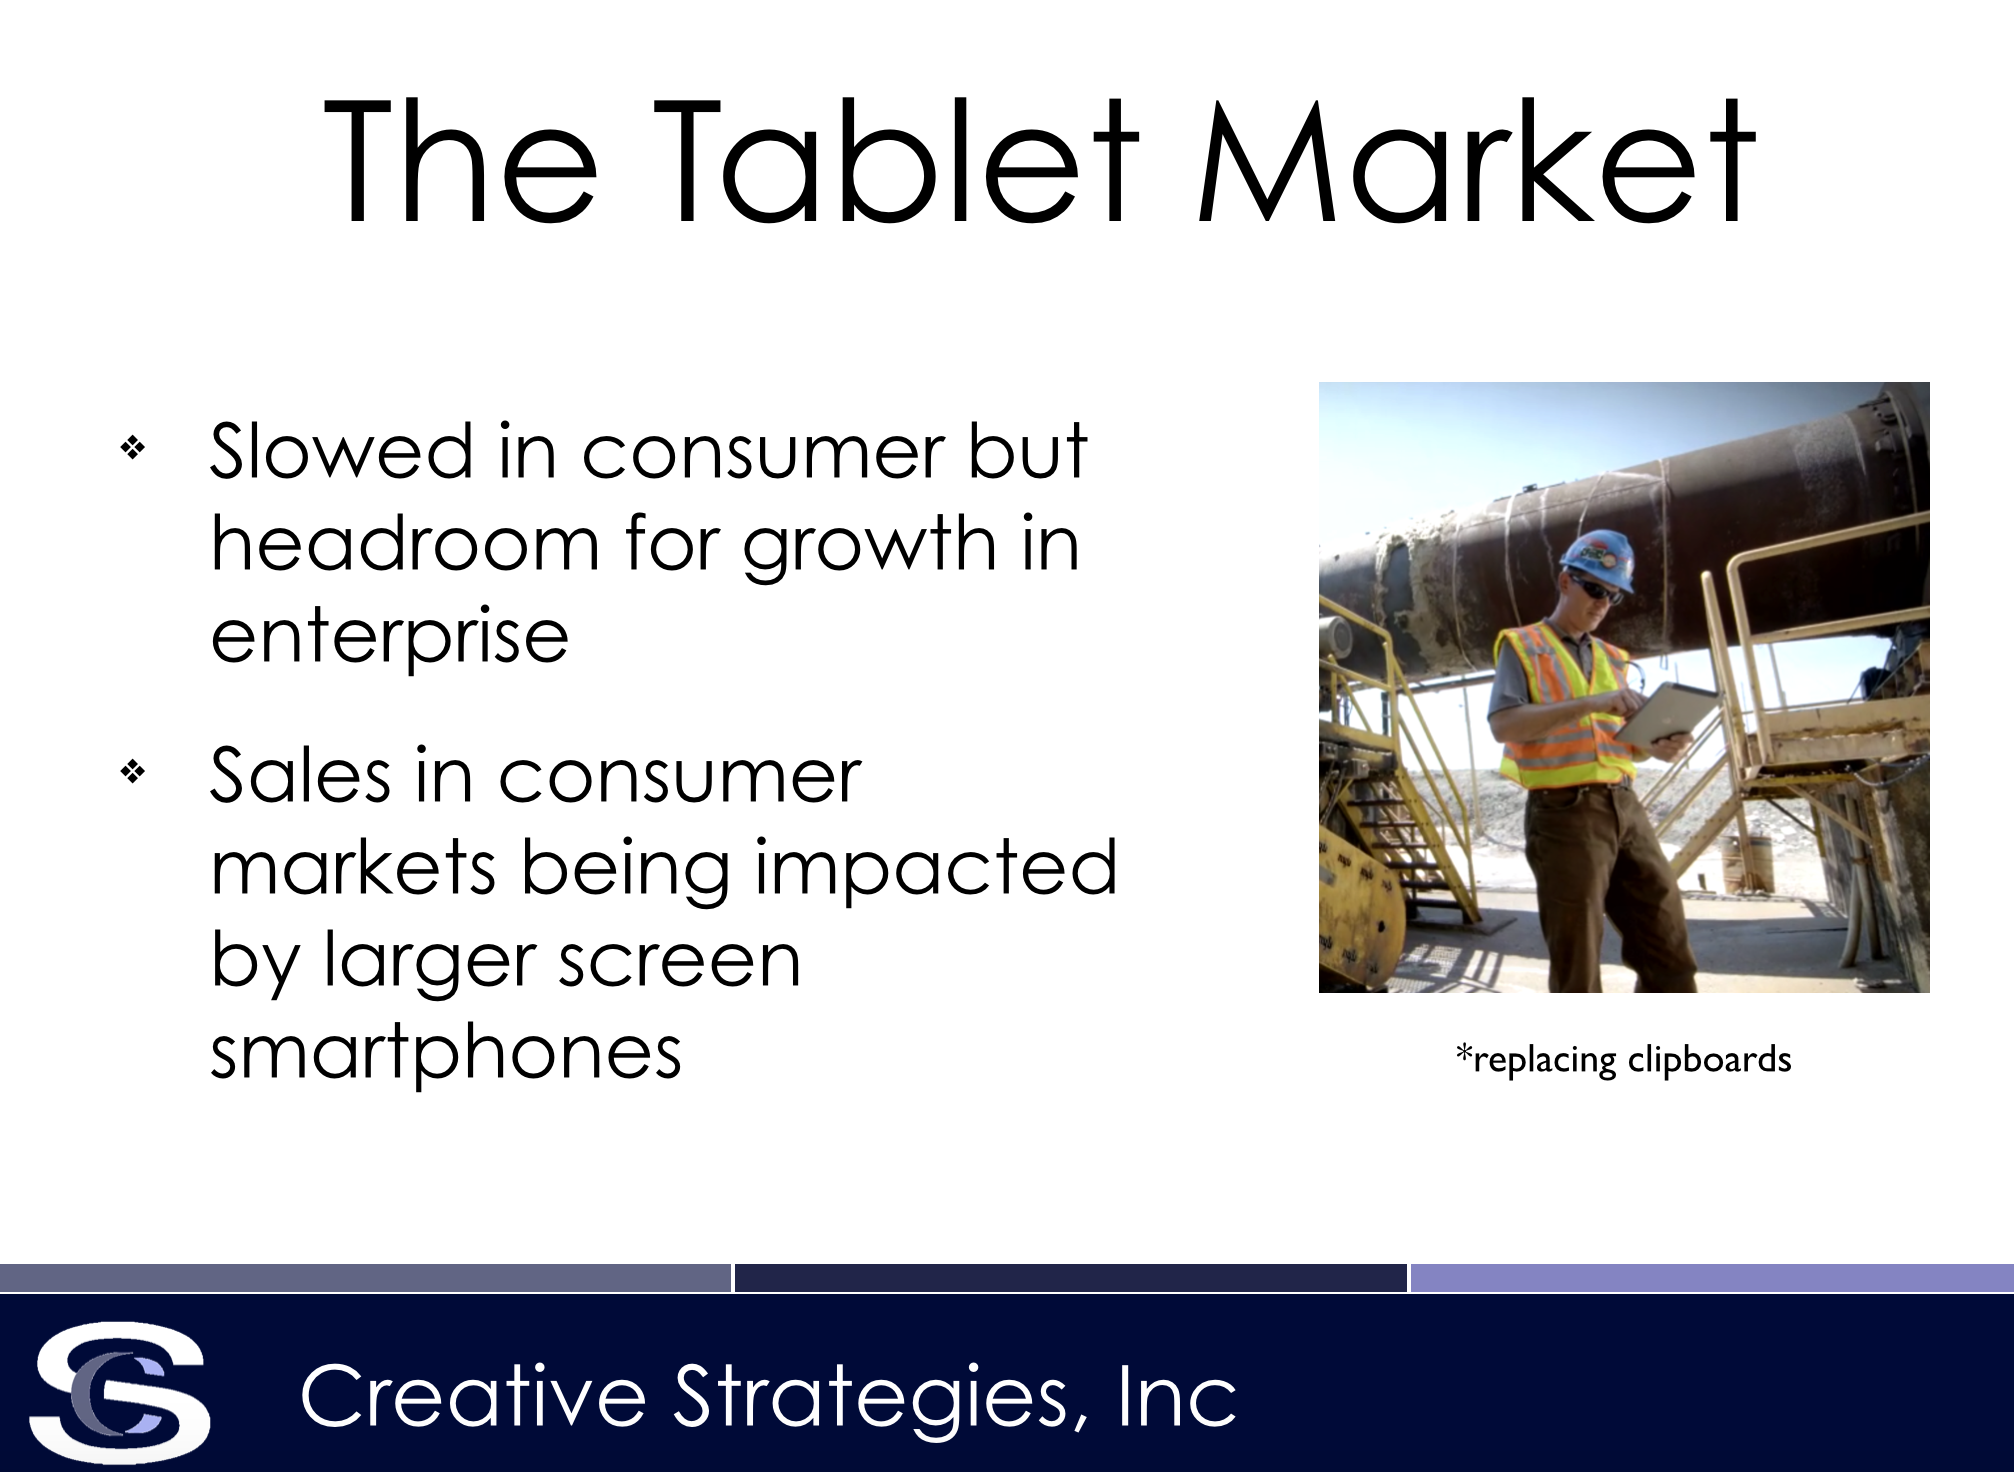
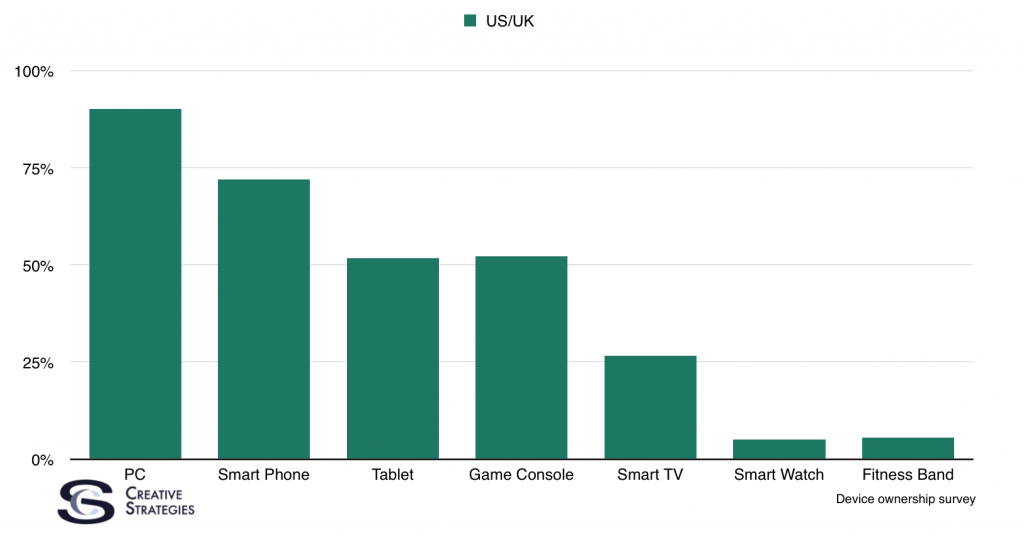
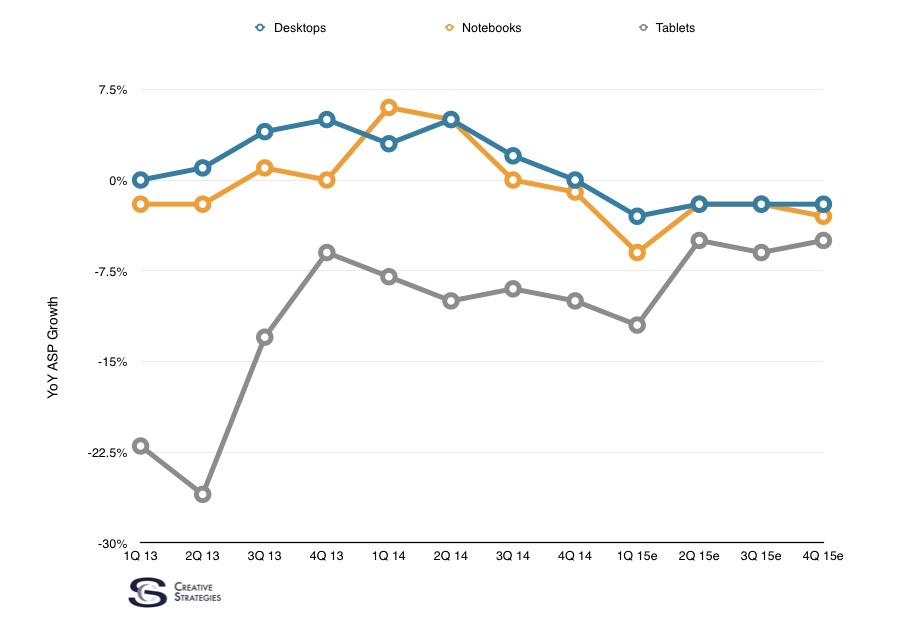
iPad Continuing to eat into PC replacement sales
Articles came out, post-CES, claiming the PC is interesting again. These articles are not wrong. However, with as much press the PC is getting and even with as many interesting innovations coming to PCs from all vendors, our firm and many others are still anticipating -6% to -8% (with a bear case of -10%) decline in the category in 2017. Those forecasts take into account all the interesting things coming to PCs.

I am still bullish on iPad. Call me stubborn but I am. I maintain all these wonderful innovations coming to PCs still over serve the mainstream consumer’s needs. Yet, I acknowledge the mainstream consumer still wants/needs more than their smartphone for many tasks which fall into the productivity and creativity department. We believe, as consumers get more comfortable around viewing the iPad as a PC (notebook/desktop) replacement, the iPad becomes an attractive platform for them to choose for these tasks.

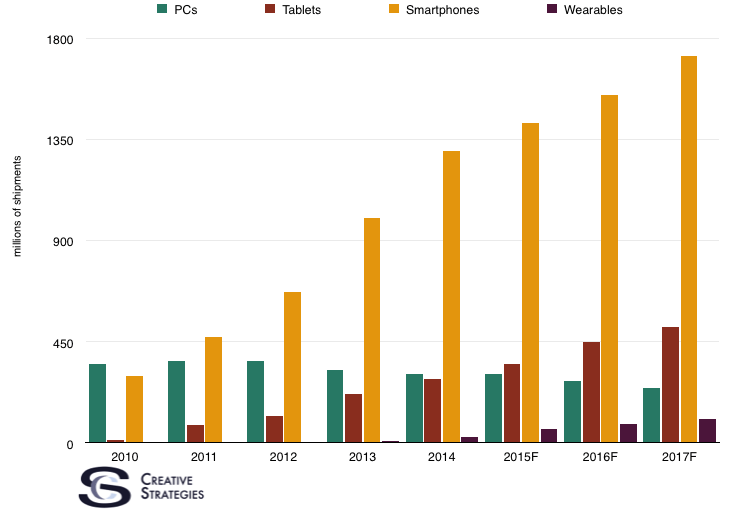
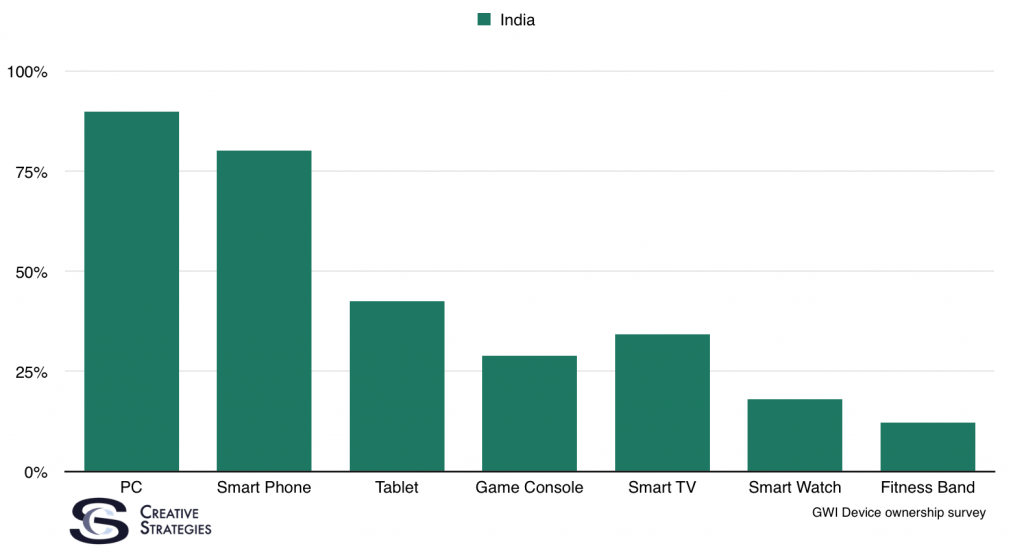
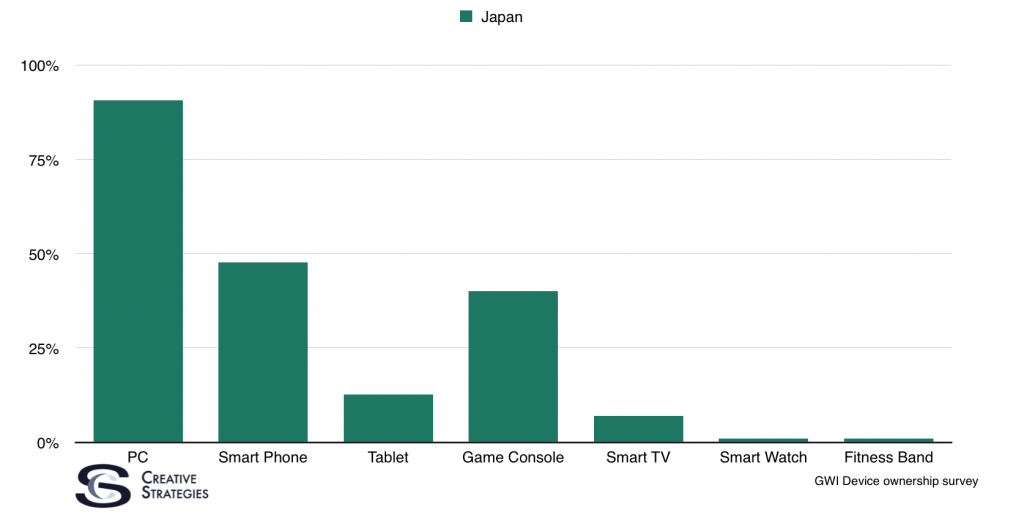
We have been counting sales of iPads as part of the PC category for years and now many other analyst firms are doing the same. Which means, should the iPad hit the opportunity with consumers we believe it is being positioned for, we will see Apple’s share of the PC market grow dramatically in 2017 or possibly 2018.

With Apple’s move to make the iPad more directly compete with PCs, we expect their iPad products in 2017 to continue to take aim at mainstream consumers considering a new laptop will consider the iPad instead. This is, I believe, the ultimate opportunity for the iPad.

Siri – Voice Assistants
Siri is, for Apple, both an opportunity and a challenge. I’ll focus on the opportunity here. Siri remains a strategically important factor in my analysis. It is the one major feature I believe will deepen consumer loyalty to Apple in perhaps unprecedented ways, which is saying something, given Apple’s customer loyalty today. Siri has the opportunity to become your ultimate helper. We use the word “assistant” but that seems too vague. Siri has the potential to become something closer to your secretary or your concierge. The true helper that helps you get things done, manage your life, learn new things, and more in even better ways than you do today. This is the upside and Apple understands this. As they did with last year at WWDC, I expect more advanced Siri APIs to show up this June at the developer event. As Apple gives third parties more hooks to use Siri and better serve the customers of their service, apps, and more, I think we will see Siri gain the trust of Apple customers. But that trust is not quite there yet, which is the root of the challenge.

Challenges

HomeKit
In all honesty, HomeKit support is less further along than I anticipated. A key part of my analysis related to Apple revolves around them having one of the most desired, profitable, and important customer bases in the world. This reality has afforded them a number of structural advantages. Specifically, a robust third party software ecosystem creating unique, proprietary, and vastly better quality apps on iOS than on other smartphone platforms. A key assumption around HomeKit and smart connected appliances from third parties leveraged this viewpoint to conclude hardware companies would integrate HomeKit because they want to target customers who have money to spend on their products. This, however, is not happening at the pace I and many others expected. In fact, many of these vendors who used to be, or should clearly need to be Apple partners with HomeKit, are specifically not embracing HomeKit and instead supporting Google Home and Amazon Echo/Alexa.

All of this feels counter to logic. There are more iPhones in the market than Google Home or Amazon Echo by orders of magnitude. Yet the biggest names selling appliances, connected hardware for the home, etc., are not embracing HomeKit. This is troubling. Part of the issue relates to Apple’s requirements to be HomeKit capable which includes a hardware chip and participation in a particular security/privacy policy. Both things are good, since security and privacy will be essential to move the smart home into the mainstream. But, at the moment, it seems like vendors are not embracing HomeKit at the rate they are other ecosystems and Apple needs to work to change that trend.

We have a really long way to go in this space but these vendors don’t write their own software or manage their own cloud systems. This is where Amazon is seizing this opportunity and it will be interesting to see how they battle or support Apple with their own development of Alexa. I consider Amazon’s structural advantages in these areas to be a challenge for Apple.

Siri’s Challenges – Building Trust
During a round of qualitative interviews with about a dozen average consumers I spent time talking to, I heard the words “Siri is stupid” more times than I expected. Siri remains, by far, the most used voice assistant in the global market today but I’m not sure Siri has completely earned the trust of its users. Several folks in our interviews said they use Siri for some things like setting timers, reminders, etc. but then use Google voice search (via the app or web) when they need to find something out. There is no question Google search is better and I fear the main use case for voice assistants being a web search is not leaving the best first impression of Siri with its users.

As I noted in my article on AirPods, the criticism of Siri not always understanding you, or missing what you are saying, were greatly diminished with the AirPods thanks to better background noise cancellation and beam forming mics able to pick up my voice clearly. Even if we acknowledge some of the issues with Siri are not necessarily related to the backend technology but the microphone, or internet connections or some other variable, we can’t ignore that consumers see this as a failing and blame Apple or Siri and then are led to believe it isn’t good or doesn’t work as it should. It is the sentiment around consumers trusting Siri which is my biggest concern with the technology. I’m not sure consumers’ first impressions with Siri are what Apple wants or hoped for and it may be a case where having it in beta and putting it into consumers’ hands too early was a worse idea than waiting until it was absolutely ready. Only time will tell.

As we study this space over the next year, a major focus will be about sentiment and trust of these assistants. We want to learn which ones they tend to depend on more than others or in which situations than others, to get a better picture of how this may play out. But, right now, from data of customer satisfaction we have from a previous study, it seems the Amazon Echo and has higher customer satisfaction than Siri which gives Amazon the early edge in setting a better first impression.

I am not counting Apple out, not even close, but I do think some of the more negative first impressions Apple has had with Siri simply mean they have to work that much harder to establish trust and confidence that Siri is the assistant most worthy to add value to consumers’ lives.

All in all, Apple remains incredibly well positioned in many areas currently relevant as well as ones which will be relevant in the future. That does not mean they are not up against perhaps, more challenges than in previous years. It will make 2017 an interesting test for the company and their current leadership.

Unpacked: Global Social Media Usage

Looking at many different social media networks/services from a global perspective, there are a few interesting trends, none larger than Facebook. Literally. On a global scale, Facebook not only has the most active users but also the most engaged ones. When consumers are asked how frequently they use specific social media sites/services, Facebook returns the highest at a global level than any other network.

Screen Shot 2016-05-22 at 9.00.50 PM

Between Twitter, Instagram, YouTube, and Facebook, the latter has the highest number of customers saying they use the service more than once a day. In terms of consumers using it daily, and even more than once per day, Facebook is more level with services like Instagram and YouTube. Ultimately, this statistic is the one I’m most interested. All these networks/apps/services can state their daily active user numbers. However, knowing how many of those people come back multiple times a day is a key understanding.

Engagement matters when you sell ads. Not just duration but frequency. Adding to this, tracking the duration of these multiple interactions is also a key statistic to understand. But only Facebook would have this particular data. I say this because there are many bodies of research which suggest the longer a person is on a site where advertising is common, the more their brain learns to ignore the ads during that session. People who go back frequently tend to see more ads than those who spend longer times on a site but only as one session. This is one insight I learned from working with ad networks a few years ago. Which is why looking at frequency per day is more interesting to me than just daily usage.

Looking at the chart you will see WeChat listed. I looked at this data by China only (since that is where most of their active users are) to show how engaged WeChat users are in China. This is actually Facebook’s goal since WeChat is a platform by most definitions in China and has a deeply engaged customer base. I also show WeChat in China vs. Facebook globally to demonstrate the uphill challenge Facebook has in China against WeChat. We know Zuckerberg wants badly to get into China and views it as a major growth area but I tend to think the dust has settled there with WeChat. Facebook will have a challenge becoming the dominant network in China the way they are in other countries.

Circling back to WeChat’s dominance in China from a frequency standpoint. While it comes in at 54% of their users using it more than once a day in China (compared to Facebook’s global number 49%), WeChat’s global number is below 30% of active users accessing it more than once per day. However, that 54% local to China number is higher than the local, country only, statistic of Facebook multiple user sessions per day. The country with the most active Facebook users saying they frequent the site more than once a day is Sweden at 37%.

WeChat’s high-frequency usage in their home market is a sign of what can happen when a commerce platform, messaging platform, and social platform all come together in a single product. Facebook wants this to happen and, if they do, we will be checking all the markets we cover to see if daily frequency goes up. Besides simply adding new customers, increasing their frequency is a key to their growth in my opinion.

Earnings Insights and Key Charts: Facebook, Amazon, Samsung

Facebook Earnings Takeaways

While there are some key reasons to be cautious about Facebook (namely teens in the US are slowly beginning to disengage), Facebook’s earnings showed they are growing in many key areas where investors want to see them grow. This chart in particular is the first I look at each quarter when Facebook releases earnings.

Screen Shot 2016-01-27 at 1.42.35 PM

This chart is telling because it has typically shown Facebook’s challenge to monetize the rest of the world. The big concern for Facebook was they could not grow revenues outside of the West. Clearly, Western markets are extremely valuable. However, you can only extract so much value that leads to growth from one market. Facebook needs show they can grow in other markets as well. While all of Facebook’s other markets are nowhere near the revenue of the US, the key point is they are growing.

In Friday’s Unpacked, I shared some data specific to Facebook’s advertising upside. The question of capturing a greater spend of advertising budgets was brought up frequently on Facebook’s earnings call as analysts were trying to understand the nature of their conversations with advertisers. Facebook’s management reinforced that advertisers were very happy with the return on their investment spends with Facebook, claiming quality of ads had much to do with it. With Instagram poised to capture more of an advertising share of the wallet as well as Facebook at large, it seems investors see the key challenges facing Facebook as being overcome. If they continue to show growth, not just in US which seems likely, but in rest of the world by increasing ARPU in other regions on a quarter-over-quarter basis, I expect their stock to continue to rise.

Amazon

Screen Shot 2016-01-31 at 10.05.02 AM

By most accounts, Amazon had a great quarter. Yet, their performance fell short of expectations in a few areas. Some underlying numbers may be what is causing some pause with investors.

Amazon is poised to continue to dominate the US retail to e-commerce shift. This is likely a winner take all, or at least most, scenario and Amazon is that winner. As I dug through some of the numbers and several hedge fund research notes, an interesting bit of information surfaced related to Amazon’s fulfillment costs. This is one key point listed as to why Amazon didn’t beat consensus estimates. Amazon’s fulfillment costs rose in Q4 2015 after four straight quarters of decline. In short, their factories were at max or demand exceeded capacity — causing them to run less efficiently (slower shipping, packaging errors, more overtime hours, etc.) to meet shipping deadlines and demand. As one financial analyst pointed out in their research note, “We think Amazon’s 4Q15 demand was even greater than it estimated.”

While this is a reason to be bullish, it means Amazon needs to invest more of their profit into more fulfillment centers. Analysts are forecasting Amazon’s fulfillment costs to be higher in 2016 and 2017 as they invest to meet demand. This is another area where Amazon’s investment in additional delivery fleets come in. While many speculated Amazon would invest and build shipping fleets to eventually replace their partners like UPS, USPS, and FedEx, they seemed to calm investor concerns around that point by stating their fleet investment is designed to help meet demand, not replace existing partners.

Long term, Amazon needs to make strides in India. If their dominant market and growth story depends on the US, they will only grow to a point. Amazon is still a distant third to Snapdeal and Flipkart in India, but India remains a market where e-commerce is poised to grow in dollar value. This will remain an important part of the Amazon story to watch.

Samsung

Similar to Facebook, I have a specific chart I look at for Samsung. Here it is, as charted by Jan Dawson:

Screen Shot 2016-01-31 at 10.27.18 AM

Readers will know I am not optimistic of Samsung’s mobile/smartphone side of the business. Their blended ASP was about $180. That’s ASP of smartphones and feature phone sales which totaled about 97m units combined for the quarter. Their feature phone sales declined ~15m units and smartphone shipments were around ~82m. With smartphone shipments up and feature phone sales down, the flat YoY blended ASP of $185 is not a good sign for the unit. Smartphone ASPs were then ~$225 range which was lower than last year’s Q4 by my estimates. Their tablet ASP was also around $180 even as shipments rose 1m units to 9m for the quarter. This tells us one singular story: Samsung sells a lot of low-end phones and low-end tablets. Competing in the low-end is not sustainable and they will lose this battle to the Chinese.

What is perhaps of more concern is the components division struggles. However, realizing most their components and margin are geared to sell to high-end manufacturers and the high-end is becoming mostly saturated and seeing slower growth, this is not terribly surprising. Which means these groups will likely continue to struggle. The semiconductor side of the business is where a lot of their upside is, in my opinion. However, with Apple rumored to go back to TSMC for 100% of the iPhone 7 business and Samsung’s mobile unit rumored to go back to Qualcomm in more of their mid-high end devices, it seems the outlook for components is not rosy.

Their consumer electronics division fared well, but this was on the back of higher margin 4K TV sets being up YoY at retail, mostly US retail.

2016 is likely to be a very tough year for Samsung all around.

Underestimating the iPhone

As a whole, Apple is generally regularly underestimated as a company. However, with the iPhone making up such a large percentage of Apple’s revenue and many calling Apple an iPhone company, that underestimating extends to the iPhone. Apple’s and the iPhone’s growth significantly has to end, is the common narrative. Apparently, it is not sustainable in the minds of many.

Screen Shot 2015-10-27 at 4.35.40 PM

The smartphone market is a big one. The biggest market of any consumer tech product. It’s the only product almost every adult will own some day. Apple’s share of smartphone sales for the calendar Q3 2015 quarter was 14.5%. The dynamics of the global smartphone market are hard to read for many but have been clear to me for some time. As markets mature, consumers start becoming more refined in their needs, wants, and desires with a smartphone. This simple dynamic is what led Apple to have the highest number of consumers upgrade their smartphone to an iPhone from an Android phone. This dynamic, which is a result of both the maturing of markets like greater China and Eastern Europe, is an underappreciated one in terms of the iPhone’s upside. Another statistic I’ll share from our primary research is, while our data returned a 28% switching from Android to iPhone number, 26% of Samsung owners in our panel indicated intent to make the iPhone their next smartphone.

During yesterday’s earnings call, Tim Cook shed some interesting light on this new user question. The Android switching dynamic is certainly a new user addition to the Apple ecosystem. However, some interesting stats were shared about China as well.

– 50% of iPhone buyers in China buying a iPhone 6 and up are buying their first iPhones
– The number of first-time buyers was even higher than 50% for those who purchased an iPhone 5s

The key takeaway is that the new iPhones are driving new users to the customer base, especially in China, and the legacy models are playing a significant role as well in driving new customers. This later point on the 5s gives me an indication the iPhone 6 and 6 Plus, at now discounted rates, will continue to drive this dynamic of adding customers. Cementing again the theme of last year that the year before models are drivers for Apple in the lower-tier price points. Take this point and apply it to the iPhone 6 and 6 Plus. These phones are so well built and the SoC so well made, they can last quite a long time in the market. Next year at this time, the iPhone 6 and 6 Plus will still be in the market and discounted even more than they are right now. They will still be competitive in the overall market and even more attractive to first-time buyers/switchers by hitting lower price points. Meaning, Apple’s lineup is strengthened each year with last year’s and the year before model at addressing many different price points and, remarkably, still competing at those price points several years later with newer Android phones.

The vast majority of Android vendors are fighting the trends of the race to the bottom. Android is suffering from the “good enough” problem in many markets. This makes it hard for vendors to have cutting edge specs or genuine innovation, which is helping tip the market in Apple’s favor as global markets mature. A truly fascinating dynamic to understand.

With only 31% of the base upgraded, 69% of Apple’s global installed base is still ripe to upgrade. Based on my estimates, that breaks down to roughly 320-330 million consumers still needing to upgrading. How long this transition of the base will take is unclear but roughly 330 million consumers are ready for an upgrade.

Lastly about iPhones. China seems to keep stumping many Apple watchers. Interestingly, we are now starting to see seasonality for Apple in China in ways we did not before. Note my chart of Apple shipments in US and China.

Screen Shot 2015-10-27 at 6.10.11 PM 
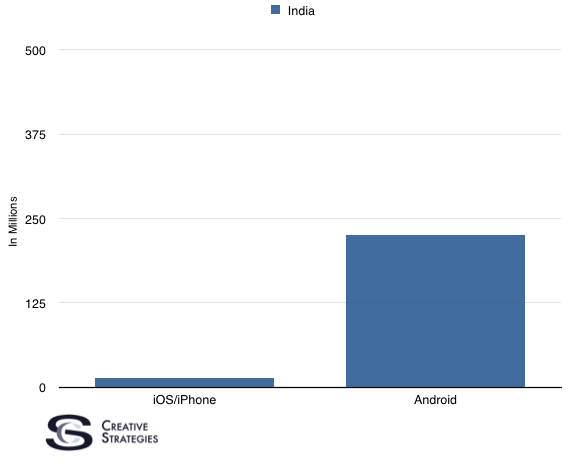
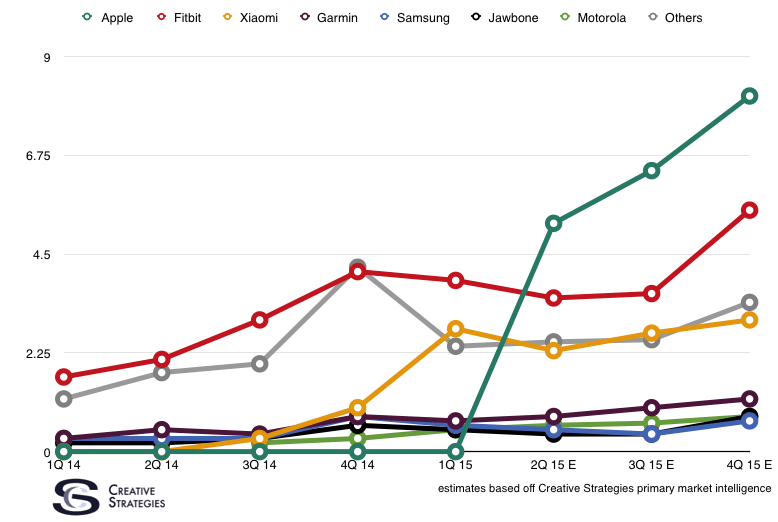
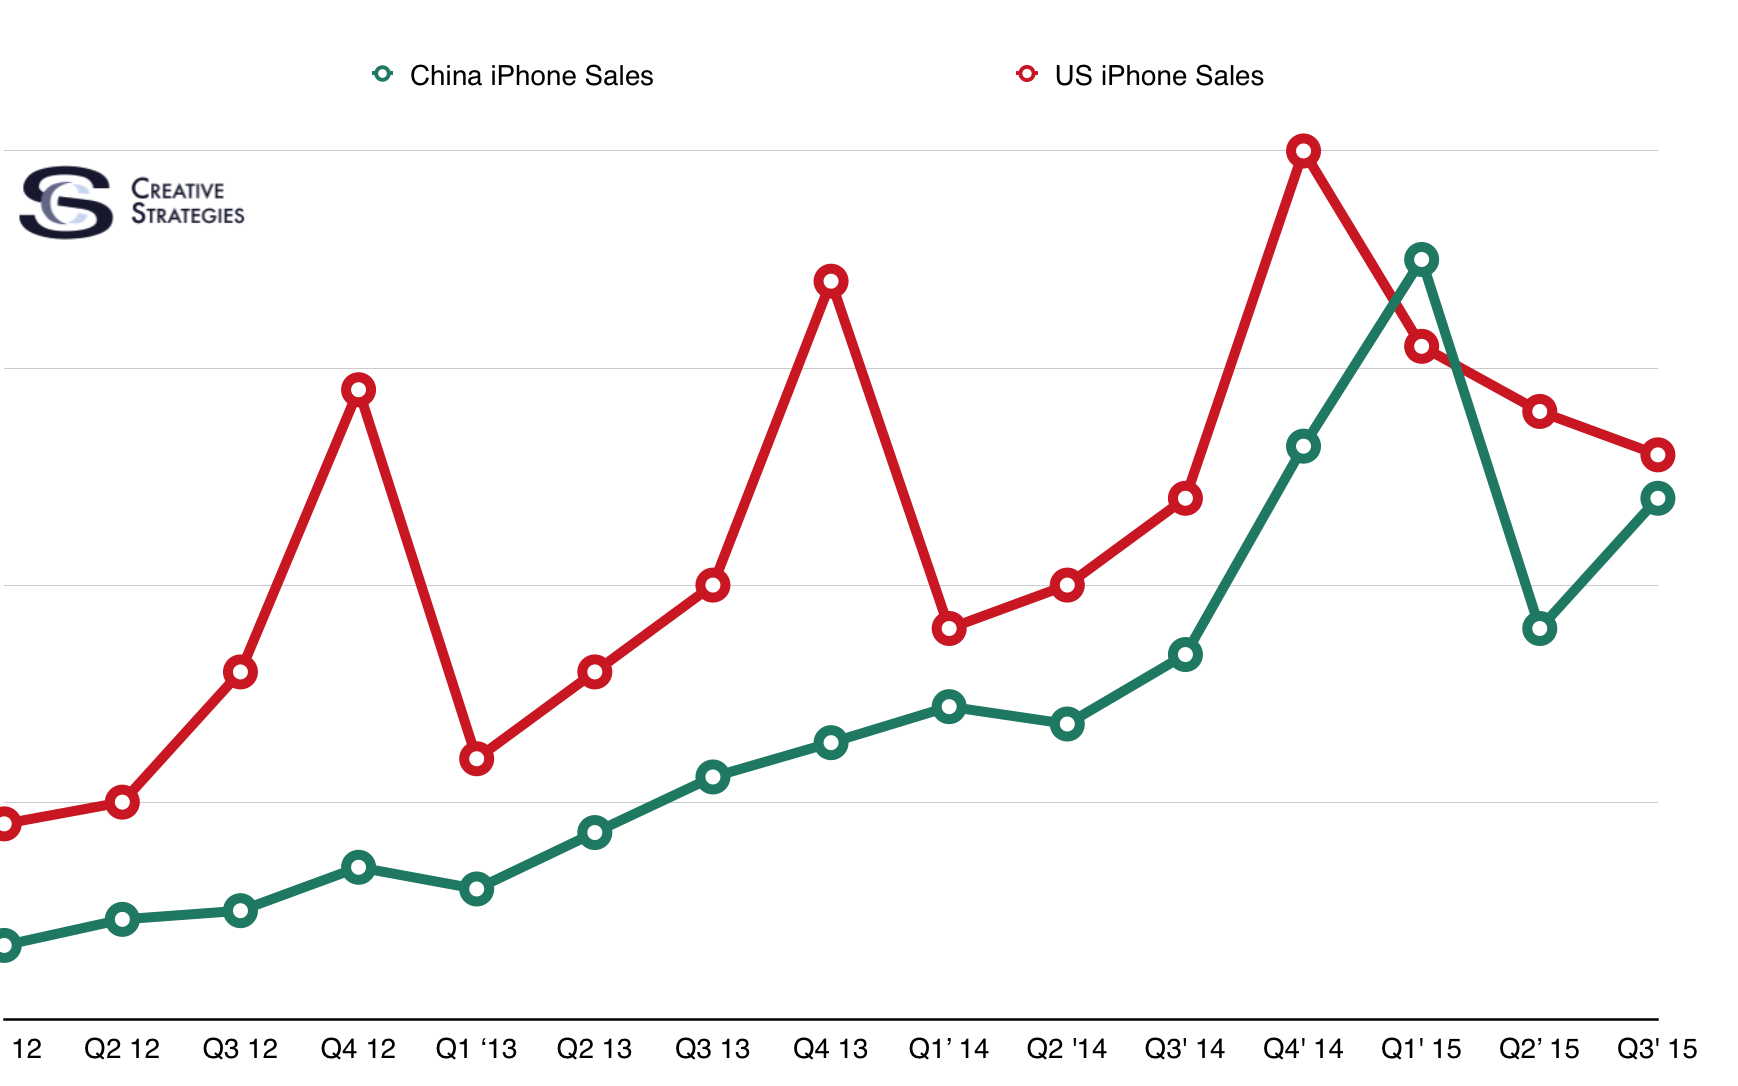
(Forgive me for not revealing the Y-Axis as the hard data is for our institutional clients)

As you can see, Apple’s shipment line in China was steadily going up. Now, it has seasonal variance just like the US market has for some time. These dynamics are new, with no historical comparables to lean on. Even other Chinese OEMs who sell in China don’t have this same degree of seasonality. This means the two biggest quarters for iPhone growth will come from the Dec holiday quarter for many markets and the March Chinese New Year holiday quarter. These two quarters alone made up 42% of Apple’s fiscal year shipments of iPhones. I expect that percentage to rise as a part of Fiscal 2016 iPhone shipments.

China seasonality is helpful for the overall model and looking at similar big shopping quarters in other markets for Apple could help understand the growth signals as well.

A few other highlights:

  1. Mac: 5.7 million Macs is incredibly strong, given the PC environment we are witnessing. This is fueled both by enterprise sales as well as the back to school segment. Feedback we got from IT managers and CIOs was the Macbook was gaining traction in their workforce and we heard similar with students. I’m looking for a 6m+ Mac shipment quarter in Dec.
  2. Apple Watch: Based on math I feel is reasonable and logical and given several assumptions of products in the “other” category, I’m fairly confident Apple Watch sales were in the 3.5-4m range for the quarter. Up sequentially is a postive sign and feedback I’m getting from many retailers is positive for the direction of Apple Watch sales next quarter. Most importantly, though, Apple Watch owners love it.
  3. iPad: I’m not as worried about this category as others may be. Its decline is not concerning. I do believe iPad Pro will help but this product is not on as predictable of a refresh cycle as other products. I’m willing to bet we will have some surprise iPad sales quarters, but working these into forecasts will be very tough. So consider the iPad a sleeper with some surprising quarters ahead likely.
  4. Services: Perhaps one of the least appreciated parts of Apple’s model is the services business. This business had a record $5.1 billion quarter, up 10% YoY. This is positive because it means Apple is continuing to get their customers involved in their ecosystem. Upside here can continue to come from Apple Music, iCloud storage, an Apple TV subscription service (if it happens) and, of course, continued growth in App Store revenue. All of this points to stickiness and loyalty in the Apple ecosystem.

Things are looking positive for Dec for Apple in many vectors. The market dynamics we are seeing change in real-time in categories like PCs, and smartphones, are truly fascinating and again teach us new things about consumers in these segments. All of this makes historical comparables and “conventional wisdom” hard to base a complete model on. Luckily, we have our quarterly market research across 30 global markets and 25,000 consumers to lean on.

The Future of Consumer Hardware Belongs to the Chinese

I’m sharing a scenario, one I’m not certain will play out, but an interesting one to propose and think about nonetheless. What if the vast majority of global market share of computing devices belongs to Chinese OEMs? Huawei, Xiaomi, Oppo/Vivo are making global moves and continue to take share from Samsung. It is like we are watching a saga unfold before our eyes where a host of Chinese OEMs are chipping away at Samsung’s quarterly smartphone sales each passing quarter.

Samsung is very likely on its way to losing the crown of #1 smartphone vendor by sales annually to Apple in 2016. I don’t see their downward spiral recovering. Their unit sales of between 70-80m units will be chipped away at by a number of Chinese OEMs in the low and mid-tier and Apple on the high end. To paint the picture as of today, here is my modeling for Q3 2013 of the top smartphone vendors by volume.

Screen Shot 2015-10-22 at 11.33.46 AM

For the past few quarters, Chinese OEMs have made up over 40% of the total smartphone volume and I expect this to rise. Huawei is on pace to be the first Chinese OEM to pass 100m unit sales annually and only the third smartphone vendor to ever do it. Huawei is inserting itself as a global player. They rank highly in several markets besides China and are rising in many of the segments they compete. What intrigues me about this dynamic is it seems the model proving successful for scale in smartphones is tonscale in China then go global. Huawei did this and Xiaomi is attempting it. Oppo/Vivo grew in China and is now going global. With the size of the China smartphone market (between 90-100m smartphones per quarter at present), brands that grow and scale there are well positioned to go global. We can argue whether Huawei or Xiaomi are the Chinese OEMs of the future but I have a growing conviction whoever it is, they will come from China.

The follow-up question to this is, can this same dynamic play out in other categories? Several of the names mentioned above intend to bring PCs and more capable computing tablets in the shape of 2-in-1 PCs to market over the next year. These devices are not designed to compete with Dell or Lenovo in more commercial markets but are squarely going after consumer markets in China, India, Indonesia, and others where we see some signs of life for PC growth. Whether successful or not, they are clearly going after PC hardware designs and I bet it doesn’t stop there. What about large panel TVs (after all, a tablet is a small panel TV)? I’ve seen some pretty amazing TVs from China OEMs and it seems just a matter of time before they expand globally and take out Sony and Samsung.

Add all this together and I can make a strong case that Chinese brands will gain significant market share in smartphones, PCs/tablets, and TVs. All devices people spend a great deal of time with. While they likely won’t own the software, they will make a run at the services layer. To penetrate global markets, these brands may also integrate tightly with local players. For example, TCL has partnered with Roku as a part of their US strategy. Expect to see more of this when the Chinese manufacturers make a push in TVs.

China is good at putting together quality components, they are getting better at design and, while marketing is still a challenge, I bet they get better at that as well. The US may be a tougher time for many of them but it’s a big world out there and globally they can own significant share in all these categories. Given their ability of massive scale, quality goods, and low-price, you can argue they are as well positioned as anyone to compete for the 3-4 billion consumers who will purchase these products and for whom price is a factor due to their lower annual income.

One question I’ll also throw in (if I don’t, it will come up in the comments) is, where does Apple fit in this? I personally don’t see the Chinese OEMs impacting Apple in any real way due to the emotional element of the Apple brand and products. In markets where that doesn’t exist, like India, or in categories with less emotional attachment because they are appliances, like large glass TV screens, are where I expect the Chinese to succeed. Specifically in markets where price is an issue due to lower-income customers. In fact, I can build a strong argument that, once Apple takes the #1 spot in annual smartphones sales from Samsung, they hold on to that crown for quite some time. There may not be one Chinese OEM who sells 200-300m smartphones each year but instead many smaller ones doing anywhere from 50-150 per year. Similarly in other categories, there may not be just a few dominant OEMs but market share divided up among many.

I’d love to see more companies compete in consumer hardware but, as I pointed out here, it is tough, risky, and most VCs I work with aren’t much interested in hardware companies. China OEMs have a lot of advantages, ones I’m convinced set them up for scale, quality, and low prices in nearly every category they decide to go after. Essentially, I’m laying out a future where it’s pretty much just Apple and Chinese manufacturers in consumer hardware. I’m becoming more convinced that it’s likely this is how the consumer tech hardware market plays out.

Recognizing Your Product’s Irrelevance before It Happens

I’d like to make a few points on something I understand is extremely difficult — seeing your products’ irrelevance and ultimate market share decline before it happens. Seeing your company’s product fade is by no means easy. In fact, it may often be easier for those outside looking in than those on the inside heads down making the products.

While I feel bad for picking on Samsung so often, they provide an excellent case study in many things. However, their struggles in mobile and the actions they took to gain market share and now, lose market share, provide valuable lessons. Many of our readers will know I have been pointing out Samsung’s peaking in mobile phone sales for quite some time. Part of this is because I had the data in the charts below.

Screen Shot 2015-08-25 at 8.41.09 AM (Click to enlarge, and please don’t share publicly)

I’m showing you four of ten markets I have detailed smartphone data for. In every one of the ten markets, Samsung’s line is the same shape. In many of them, Apple is one of the significant reasons for their decline. In markets like India, LATAM, Africa, and several others, it is a combination of local brands and Chinese companies like Huawei who are challenging Samsung’s brand and product offerings. There are many reasons for the shape of their line. What’s most interesting is how their peak in many markets happened in the 2012-2013 time frame. When you ask industry insiders about this, most would say it was late 2013 or early 2014 but, in reality, their peak was much sooner. The question is, could they have seen this coming? If so, what could they have done about it?

It was clear at the time Samsung was not investing in a sustainable differentiated strategy. The weakest point in their entire offering was Android. While this was not fully understood by upper management, I do know there were a number of people in Samsung who agreed. Hence Tizen, and the many manifestations before it, was an attempt to control their own destiny. However, it was too late as the Android train was too powerful to fight against and had too much momentum. I’d argue Samsung was simply never in a position to control their own destiny and no matter what they did, any tactic was a prolonging of the inevitable.

What is interesting about this is how we are learning from history and the new dynamics we are still learning from the globally maturing consumer tech market — that many companies may be stuck in industry dynamics they simply can not get out of. Looking at how the life cycle of many companies is shortening, I think this is a significant observation and trend I don’t see ending due to these new dynamics of the industry.

There are many great books on strategy and management but I want to offer my top three recommendations when it comes to keeping your company relevant.

Understand Your Market

Given my primary job function is to study consumer global markets, I find it very interesting how many companies do not truly understand their market. This is true of public companies and shockingly true of many startups I do late stage due diligence on for the VC community. I’m often quite surprised how much money has been given to a startup when, after spending time with them, it becomes clear they don’t truly comprehend their market.

While I understand how difficult it is internally to do this, since I know how difficult and time-consuming it is, it is still absolutely fundamental. Understanding your market at a base level helps you understand customer needs. More importantly, it helps you recognize how those needs evolve. Ideally, your product will move your customers needs forward. Markets are dynamic, not static. They change both as needs evolve, competition increases, and a range of other factors move a market forward.

This is ultimately Samsung’s struggle today. They are operating the same way they did in 2012 and 2013 and believing these tactics will still work. Unfortunately, the market changed and Samsung did not change with it. Perhaps it was impossible given their structure to change, but that is a separate topic.

A key part of understanding your market is also understanding why you are successful. What is it about your product or service that is resonating with customers? Understanding the why behind the what may very well be the most profound thing you can focus your attention on. This knowledge plays a major role in how you adapt and innovate strategically for your target market. Talking to customers, understanding their needs, how your solution is solving real problems, and more are all things you can do to discover the why behind the what.

Have a Monopoly on Something

There are many ways to slice this but what do you have that your competition doesn’t? This could be any number of things, but this is key for differentiation. In relation to Samsung as a case study, a primary cause of their struggle was they use the same operating system as their competitors. Contrast this with one of the fundamental reasons Apple can do what they do — they have a monopoly on their operating systems.

What this teaches us is the importance of a primary engagement point as something you own. Price is not a good monopoly since it is likely someone will always come in and find a way to do it cheaper, unless of course that person is you. But, even then, price alone is dangerous place to be. This could be the trickiest part of a long-term strategy but finding what critical piece of the puzzle you have a monopoly on is key to maintaining relevance in the long-term.

Invest to Solve Future Problems

Lastly, and this is related to the first point about understanding your market, make investments in future problems. Customers needs will advance. Invest to lead them down this road. As your customer base and the market matures, anticipate these needs. Sometimes this means creating something new, sometimes it means disrupting yourself, but your customers needs trump the desire to hold on to yesterday. Take risks but having a deep understanding of your market and your customers’ needs — the why behind the what — are all things that can be done to help minimize that risk.

Getting Harder to Beat the Tablet Bears

I’ve been defending the tablet market for some time. I still believe the form factor offers a much more inviting and natural computing environment than a traditional PC. I’ve long argued tablets are great first computers for kids, the elderly, and many in emerging markets looking to do more than their smartphone offers, but who aren’t PC literate. However, these segments alone may not be big enough in annual shipments to sustain many players in the category. At this point, and things can always change, there are a few dynamics we have to fully understand relating to tablets.

First, a great deal of tablets’ global growth and rapid adoption since 2010 has been driven by small tablets in the 7-8″ range, and very low-cost ones. Note this chart of sales and the vast majority, ~80% on average, of tablets in the “other” category are sub $150.

Screen Shot 2015-08-12 at 11.52.20 AM

Unquestionably, replacement rate extension is an issue for iPads in particularly. A behaviour we have noted with lower-cost tablets is they are treated as disposable. In markets like India and China, where low-cost tablets saw large volume sales, it was not uncommon for these to be replaced annually. This could have played a role in the surge in volume sales from these products and is also one of the reasons I think we are seeing a decline. It is these customers, who bought tablets for sub $100 in the 2012-2013 growth stage, who are now not purchasing them anymore as larger screen phones are filling their needs. I’ve shown this chart before, now updated for Q2 2015, and we have debated it, but the signals seem be clear that large screen phones are impacting volumes of low-cost small screen tablets.

Screen Shot 2015-08-12 at 8.44.42 AM

It is unclear if larger screen phablets are impacting iPad sales, or if it is purely because the iPad refresh cycle is extremely long, but I’m certain large screen phones have dramatically impacted low-cost, small screen tablet sales on a worldwide level.

However, some recent data from DeviceAtlas may provide the best signal of the shift taking place. From their latest Q2 report, DeviceAtlas shows that internet traffic from tablets is declining across the metrics their technology tracks.

Screen Shot 2015-08-11 at 2.13.03 PM

Several of the markets tracked here, such as the US, UK, Australia, and Japan, are markets where the iPad installed base is quite high (over 50% in some cases). Which means the decline in internet usage from tablets is not just coming from low-cost, small screen Android tablets. The other point to make is the iPad has traditionally, and still does, lead in nearly every country as the dominant tablet for internet usage. So, to see tablet traffic decline, knowing how much of it globally comes from iPads, enforces again that some of this decline is coming from people using their iPads less to browse the internet. How much less? I’m not sure, but we can’t argue it is not happening.

So where does that leave us? Here are a few ways to think about where the market can go.

Tablets Become SUVs: The analogy that PCs are trucks is apt and holds water. Trucks are not mass market but are specific purpose utilities. The positioning that the tablet is more like the compact car than the truck, meaning it is more mass market than a truck, was commonly used. But perhaps the tablet needs to become more capable, functional, and powerful than a compact car but not quite a truck. Maybe it needs to become an SUV.

This is perhaps why, within iPad sales, we are seeing the mix shift away from the mini to the larger screen iPad. This may also be why there is excitement around a larger iPad, the so-called iPad Pro, which will still be more portable than a traditional PC and nearly as capable.

If this happens, these classes of tablets could compete for the 500m, or more, consumer notebooks in use that are 4-5 years old, when these devices come up for replacement.

Only the iPad and Windows Tablets Remain: Another scenario to consider is Android tablets simply fade away and the only tablet makers left are Apple and those shipping Windows tablets, largely to commercial customers. Since most Android tablets sold are being displaced by large screen Android phones, this scenario could be quite likely. I’d still argue, in this scenario, the tablets becoming SUVs is still the play.

Only Upside is Commercial: Another scenario is the consumer market for tablets becomes heavily seasonal, or only large in certain years, where the regularly quarterly and consistent annual upside is in commercial sales. I use this chart often in my presentations to show the opportunity for tablets to take computers into environments the desk or lap-based PC could never go.

Screen Shot 2015-08-12 at 9.19.02 PM

We believe workers who spend most of the day on their feet and use paper-based processes in places like factories, construction sites, retail, etc, could represent an opportunity of more than 400 million jobs where a tablet is a viable solution.

The Market is Simply Not That Big:Lastly, we may have to conclude the tablet market is just not as big as we originally thought. Many believed it could be larger than the PC market, meaning north of 300m units per year. Currently, the tablet market is on pace to barely break 200m units this year, a decline of about 25 million from 2014. Of course, this could change, but I’m not as confident as I once was, even if Apple brings out a larger one.

If we do continue to see small tablets shrink and potentially become extinct, it will be time to officially start lumping tablet sales into PC sales and stop separating them. I have a model that adds all iPad Air sales into PC sales since I consider them PCs. But I separate smaller tablets into the tablet category.

Perhaps the tablet category simply goes away as the tablet evolves and matures. Maybe it is even easier to just get rid of the labels and say we have small screen computing devices and large screen computing devices.

Apple Earnings Review

It seems it is more interesting to write about Apple earnings when there is controversy. This time, it was two-fold. Wall St. had a high degree of confidence, as did I, iPhone shipments would be above 50m units. They were not and Wall St.’s expectations were priced into the stock (which remains undervalued) and then corrected once said expectations were unmet. Apple beat their own expectations, but not Wall St.’s. This is Apple’s life.

The second controversy was around the Apple Watch. We knew Apple would not disclose sales figures. Yet many of us were confident revenue from the category where Apple is lumping Watch revenue into (“Other”) was expected to be north of three billion dollars. It was not. It came in at 2.7 billion. So this became an exercise in financial reverse engineering to figure out how many watches they sold. I have several thoughts on both story lines.

iPhone

The iPhone continues to grow. Apple will likely grow iPhone shipments for the full 2015 year between 11-18% based on my best and worst case scenarios. iPhone YoY growth continues to increase, despite everyone’s concern it will slow down. This quote from Tim Cook during the earnings call is a key part of the story:

In terms of the… what’s going on with iPhone: The 35 percent growth [year-over-year] is almost three times the market and if you look at it at a little narrower regional level, western Europe grew 30 percent versus a market of 7 [percent] so four times market; Japan grew over five times market; we doubled in Korea versus a market that was shrinking; and in India we grew at 93 percent. And this is on top of the greater China numbers that we’ve already covered that grew 87 percent during the quarter against a market of five percent.

And so we did exceptionally well, I think, in any way that you look at it. In terms of our—the percentage of customers that have upgraded to a 6 and 6 Plus versus those that have not upgraded, it’s 73 percent, meaning that 27 percent of the install base of customers prior to the launch of 6 and 6 Plus have now upgraded.

Several points to make. First, to the installed base. 7% of the base upgraded this quarter. The iPhone has a greater than 80% repurchase rate (higher according to Apple internal market research) so we know The iPhone is sticky. So it is a fairly safe assumption a healthy number of the other 73% will likely upgrade as well to a new iPhone.

Apple also noted the most Android to iPhone switchers of any previous quarter. Interestingly, this was predicted in a report from the Yankee Group in 2013 called “Android’s Leaky Bucket”. This research focused on iPhone owners and owners of some of the most successful Android devices at the time and found continually high repurchase rates of iPhone owners and much repurchase rates and interest to consider other brands including iPhones by current Android owners. Last quarter, private research I read indicated as much as 18% of iPhone sales came from Android switchers in the US and as high as 28% from China. While the US smartphone market was really terrible this last quarter, we can assume a good portion of Android switchers came from non-US markets.

To the point of other markets, Tim Cook quoted a number of growth statistics. Doubling in Korea was an interesting point, followed by a tweet from Francisco Jeronimo of IDC.

Screen Shot 2015-07-22 at 4.39.00 PM

Growth in European markets like Germany and Spain is fascinating. These were very Android-centric markets. Speculation as to why Apple is suddenly doing well could be a combination of larger screen and an emphasis on security. 93% growth in India would imply over 700,000 units sold in the last quarter according to my model. So Apple is on pace to pass 2m iPhone sales in India. Then we have China.

China will be Apple’s biggest market on many fronts before too long. Growth of 87% implies 12-14m iPhones sold in China last quarter according to my model. Economic concerns could have hurt it but I think we are still just learning what China seasonality looks like. My continued research of the China market gives me confidence that Apple’s ceiling there is still much larger giving them a great deal of headroom to grow.

The iPhone remains beautifully positioned to continue to grow and gain share over the long-term.

Apple Watch

Our projections were 4.7m Apple Watches. Acknowledging this as a tricky product to track, we were leaning heavily on supply chain guidance. We knew of several component providers with exclusive parts for the Apple Watch. Build orders and ODM output seemed to indicate build orders in the 5 million range of Apple Watch. Using some yield concerns to estimate down, the 4.5-4.7m range was our guess. It turns out yield may have been much worse than our projections and a higher build order than Apple’s sales expectations was made to compensate.

Second, it appears preorders were even weaker than expected. Which is fascinating even in its own right. Not because we didn’t think people wanted to see it and touch it before buying, but that we believed the number in Apple’s passionate user base who would quickly jump to buy this product was much higher than 1-1.5m people. While I still believe this is true, it can suggest even Apple’s base was somewhat skeptical and wanted to feel and touch before buying. Important if true.

Apple cautioned to just use the increase in revenue to the other quarter, which came out to around one billion dollars, and use that to estimate Watch numbers. Tim Cook also indicated that products in the “other” category saw declines. So we don’t know if Apple Watch contributed 110%, 120%, 130%, etc. A 10% decline is probably likely and a 20% one could be reasonable as well. With an ASP in the $430-$450 range, it seems we can work out, with a reasonably educated guess knowing what we know, that Apple sold in the range of 2.5-3m Watches. There is a way to work the math to get above 3m but I’m less confident in that scenario at this point.

Furthermore, what does this say about momentum? Apple stating they sold more in June than in April or May is positive for momentum. Catching up with supply chain and getting into retail helped momentum positively. Apple expanding retail locations and getting Apple Watch into more stores will be a key driver for momentum. And now, with low yields seeming to be fixed and the Watch in retail, we are still seeing supply chain ramp up not down. So, from what we can see, there are positive signs the Apple Watch is gaining steam from a sales standpoint.

Lastly, thoughts on the Mac and the iPad. The Mac continues to grow steadily and take share. We expect this to keep happening. The iPad is still slumping and this was expected. The iPad is selling like a notebook and is exhibiting signs it is working with PC market dynamics not mobile phone market dynamics. ~300 million PCs get bought each year and that is Apple’s opportunity to gain share of with both Mac and iPad.

Next quarter will be interesting and, while iPhones will suffer the calm before the storm of holiday new hardware, the Apple Watch will likely be a primary story again.

India: Where the Future of the Mobile Internet is On Display

Every market I study is fascinating in its own right. What keeps surprising me is the seeing how different things are in the markets I study. It would easier if all the markets were roughly the same, with the same brands, products, business models, et., all paralleling each other. But this would also be boring. I’ve outlined what is happening in China with mobile devices and the mobile internet on several occasions. Now I want to dive into India.

Mobile Only

I model global installed base of devices and platforms by country. There are several insightful points to understand about the India smart device landscape. The first is PC penetration is exceptionally low for such a large country. PC penetration (stat includes household, individual ownership, business, and Internet Cafe) in China is over 400m. In terms of pure volume, China and the US have the most mature PC audience respectively. In India, PC penetration is 10%. That breaks out to just over 100m PCs in a country of over 1 billion people. The PC in India is largely a work/business/productivity device and reflective of the number of tech workers or healthy individuals in the region. Yet, the number of smartphones in active use in India is over 250 million. Which makes India the country with the largest number of mobile/smartphone only internet users.

Screen Shot 2015-07-09 at 2.24.10 PM

India is shaping up to be the feature market showing us what a mobile-only world looks like.

One of the key stats we uncovered that got me looking into India as a template to understand mobile only markets was the share of mobile commerce, as a percent, of e-commerce vs other countries. India has the highest share of m-commerce transactions as a percent of total e-commerce than any country. Mobile share of total e-commerce transactions in India is 43%. The next closest is China where m-commerce makes up 32% of e-commerce transactions. Every other country is distant at 20% or below share of mobile commerce.

This incredible emphasis on mobility, where the mobile internet is truly the only consumer internet in India has led companies like Flipkart (the leading e-commerce company in India) to shut down their desktop website and only offer their service through a mobile app. Myntra, a Flipkart property, is also going in mobile and shutting down their desktop website. While these are several examples of companies who had a PC focus and shifted to mobile only, dozens of upstarts in India are starting with mobile only businesses and never bothering to develop a desktop website.

This is again because the internet in India is primarily mobile and with regard to the consumer-centric mobile internet it is absolutely mobile only. Because of this, we will see mobile only innovation coming out of India which we can use as case studies for other markets. I’m watching for new services in banking and finance, payments and micropayments, e-commerce/m-commerce, hyper-local services like fresh food delivery, and more. These areas are all growing out of a mobile-first environment where, even though I’m watching these services in other countries, many in Western markets particularly will still embrace the desktop web. My thesis is, the ones who focus mobile only will bring out innovations not seen yet by those who still embrace both mobile and desktop experiences. In all the areas above, from mobile banking, mobile cash/payments, mobile bill paying, India ranks among the highest in terms of mobile share of these activities.

The other thing that makes India interesting is the proportion of Android to iOS devices is dramatically in favor of Android and we see no signs of that changing for the foreseeable future. Normally, when I’d analyze a market for things like value of user (ASP), average order value with commerce, and other metrics, we would isolate iOS from Android. The basis for this is the understanding, generally speaking, that Apple customers are more valuable than Android users in metrics that matter. However in India, while the super wealthy do have iPhones and are worth more than their Android counterparts, there are simply not enough of them to truly matter. There are a number of economic reasons for this and one of the more fascinating dynamics for Apple between China and India. It is the perceived luxury which drives Apple in China, where that same strategy does not work in India. To help you visualize this gap, here is a snippet from my global country by country installed base model by mobile OS. This is India, iOS vs. Android number of smartphones in use.

Screen Shot 2015-07-09 at 3.30.06 PM

Apple will be challenged in India. Even though there are aggressive sales of the iPhone 5s happening, I’m hearing from users on the ground the legacy experience is not competitive with modern devices and leaves a sour taste in consumers’ mouths. India will be a challenge for Apple.

However, the point remains, what we are seeing happen in India in developing as a truly mobile only country is fascinating. While every mobile only example may not work in other markets, it is helpful to understand what is happening in the region and learn from any relevant innovations.

Discuss in the Tech.pinions Forums: What can I tell you about tech in India?

Forum Topics: Microsoft Smartphones, iPhones in China, Slice Apple Watch Data

One of the ways I’m using our new forums is to share some shorter posts and solicit more of a discussion around certain topics. So I’ll frequently post a short post, or top of mind thought to the forum. To let everyone know there is new content there I’ll create a post like this one and link to some of the newer topics I’ve posted in the forums. Here are the recent posts with some commentary by me to get the discussion going.

How Long Will Microsoft Keep Making Smartphones?
With the recent news of layoffs and restructuring what is the future of Windows Phone and does Microsoft need it to be successful.

Latest iPhone In China Charts via Baidu
Long time readers will know I have access to data from Baidu (China’s leading search engine) that helps me track iPhones in China as a percentage of iOS devices accessing Baidu. I’ve updated these charts up through June and added some commentary around the most recent trends.

Thoughts on Slice Apple Watch Data
I shared some of my thoughts on the Slice Apple Watch sales data that is circulating the news outlets. There is already a great discussion happening on this forum thread.

If you haven’t already be sure to check out or new subscriber only forums. I firmly believe our site has the smartest readers and commenters of any site out there so I deeply appreciate your engagement and we created forums just for this community engagement. There are also a few subscriber initiated forum topics on switching from Android to iOS or Vice Versa and the Future of the Apple Watch. I encourage you to check those out as well.

Forums.Techpinions.com

Report: Apple and Fitbit Dominate Wearable Market

As a part of a broader report I’m developing for my company’s clients both in the tech and financial industries, I’ve been modeling our views on what happens in wearables for the next few years. I will break out smart watch shipment estimates and health and fitness devices separately, although each category is intertwined in the wearables category. Taking a step back and looking at the macro view of the wearable market up until the launch of the Apple Watch, Fitbit was the dominant vendor in terms of unit shipments. Fitbit’s share of the health and fitness tracker wearable market was just over 70% in 2014 and over 50% of the total wearable market shipments even when smart watches are included. However, the problems with the current health and fitness market loom and must be solved for us to continue to believe in the upside of dedicated health and fitness trackers.

To put our view of wearables for the next few years into perspective, I’ve mapped them among our forecasts for other primary computing devices.

Screen Shot 2015-06-29 at 2.43.27 PM

As you can imagine, doing a forecast like this for something unknown like the wearables category is tricky. It is loaded with assumptions which we build into our reports for clients. I typically like to create a bull-base-bear scenario for each forecast outlining things to watch for which may signal the way the market is heading. But for now, we will operate on the assumption the wearables category will continue to gain interest globally. However, I do feel the next few years will signal more of a shift toward smart watches or perhaps smarter, more capable health and fitness bands than the basic health and fitness wearables which make up most of the market to this point. I’ve charted that shift here.

Screen Shot 2015-06-29 at 1.18.04 PM

Screen Shot 2015-06-29 at 2.59.48 PM

Apple’s entrance to the category has contributed and will continue to contribute to a massive YoY growth spike for smart watches in 2015. We continue to see year-over-year growth in smart watches, more so than health and fitness bands, largely driven by the Apple Watch over the next few years. Where we do see some upside, and it is reflected in our forecasts, is in basic health and fitness bands, including ones with more sophisticated health sensors, that are starting to be adopted by doctors and health insurance companies and prescribed to patients with specific health conditions. This class of product would be purpose built as to pass the required regulations to be used and integrated into a health provider’s services.

Apple vs. Fitbit

I’m sharing a chart from my proprietary model of sales estimate and forecasts by specific vendors. I do ask our readers keep this chart private and don’t re-post it to the web for free. I build these models for investment firms and they are quite valuable. I have this model built out through 2016 but, as to not give too much of that away, I’m showing and will walk you through my estimate only through 2014.

Screen Shot 2015-06-29 at 1.19.12 PM

My initial estimates for Apple Watch sales appear to be tracking for both calendar 2015 and a full year of product availability. I’m still confident in our estimate of 19m Apple Watches in fiscal 2015 sold and the momentum is gaining toward the back half of the year as evidenced in our primary research of buyer intent. Supply chain sources continue to validate shipment momentum and, knowing Apple’s retail inventory tactics, it can only mean, as supply is catching up with demand, sell though remains in line with supply chain output volumes we are tracking.

As you can see from our estimates, the wearable market is a two horse race between Fitbit and Apple. While Xiaomi, with their low-cost MiBand, has come to the party and taken share, it still remains relatively low compared to Apple and Fitbit. We expect Xiaomi to stay committed to this category and hear other wearable products are in the pipeline.

I believe Fitbit will still carry some momentum and Apple Watch’s presence is what we believe will help Fitbit continue that momentum. Our buyer intent surveys around wearables have seen a dramatic increase in interest both in intent and consideration for the category since Apple’s entrance. This backs up many analysts views that the Apple Watch will help float all boats in the category. However, our surveys indicate it may help float FitBit’s boat more so than other wearable products and we don’t know yet for how long. FitBit has higher brand awareness than any other wearable–other than the Apple Watch–and the money they raised with their IPO should help them spend on marketing, IP, and future products. I have a bear case for Fitbit that keeps them competitive a while longer. These are the base assumptions being used to forecast Fitbit’s model through the end of the year and into 2016. This holiday season, both the Apple Watch and Fitbit products will likely see the strong seasonal bump the category saw in Q4 2014. This Q4 2015 is likely to see a much larger spike, thanks to the Apple Watch.

Where the Apple Watch will really outpace Fitbit is in their China momentum. As I outlined in my China smart phone report, Apple is becoming a genuine force to be reckoned with in China. While we surveyed the landscape in many markets, it was China that had over 20% of respondents who claimed a strong intent or a definite plan to buy the Apple Watch. China’s iPhone installed base is near that of the United States with nearly 100m units in active use (the US is over 110m units now). With such a strong and growing base of iPhone 5s (the single most owned iPhone in both China and US) and above, the China market is a hot zone for the Apple Watch.

Microsoft is the dark horse to watch. Right now, our estimates are the Microsoft Band has less than 10% market share of the health and fitness market, but they are only on version one of their product. If version 2.0 is much improved, it could help Microsoft grab market share, likely impacting FitBit, in the health and fitness wearable market.

The China Smartphone Market Report

Every so often for subscribers I do a deep dive on the China smartphone market. I’ll do another one on India in the upcoming weeks. We have some recent data on the China smartphone market I think paints a fascinating picture of what is happening as it relates to several players, and Apple in particular.

China is like no other market I study when it comes to not just mobile but the mobile internet. While we may be able to glean insights from the mobile internet trends in China and apply them to other areas, I’m not convinced we can apply the hardware trends — namely, the size of the market for customers willing to pay extreme premiums to own iPhones.

Overall View of the Market

I track global sales of smartphones by vendor, but also break them out by region. Here is a view of the market share paths of the major vendors since early 2013.

Screen Shot 2015-06-22 at 12.45.17 PM

As you can see, the story of China’s smartphone growth was largely about Android, but also being driven by local manufacturers. In a market which grew from an average of 60 million units a quarter to over 100m units a quarter, there was plenty of share to go around. China was cutting their teeth on mobile and local vendors and low-cost handsets were driving the growth. All along, those of us who study the market knew Apple had a high aspirational brand but had yet to see the masses move. One thing these vendor share charts don’t show is the secondary market or the grey market. The market where iPhones are bought, not through official channels, but through unofficial ones. Remarkably, amidst the rapid smartphone growth of local vendors, Chinese consumers were buying iPhones in such significant numbers where, for a period of time in 2012, illegitimate iPhone sales made up 9-10% of all smartphones sold per quarter in China including through legitimate channels. Which, if legitimate plus grey market shipments were counted, would have put Apple in the top 5 of smartphone vendors by sales volume in China going back to 2012. Our research revealed that, during the time period, grey market iPhones sales were nearly double the number of iPhones sold through legitimate channels. This is why the device usage data from Baidu/Umeng had such high usage rates of iPhone 4 and 4s during that time frame. Such high penetration can only make sense when we add both grey market and legitimate market sales.

Screen Shot 2015-06-22 at 12.58.37 PM

As you see from the chart over time, the huge base of iPhone 4 and 4s owners began to diversify and Apple began bringing new customers into their ecosystem as they cut more deals with local carriers with China Mobile being the driver of Apple’s growth push in China.

Android remains the dominant OS in China’s market of now over 600 million smartphone users. It wasn’t until the launch of the iPhone 6 and 6 Plus that Apple began to pull ahead as the majority leader in market share for the premium smartphone market in China. By vendor, Samsung and Apple were the two primary drivers of the premium smartphone market with Huawei and a few offerings from Xiaomi in the mix. Thanks to the iPhone 6 and 6 Plus, Apple’s share of the premium market is now over 60%. Furthermore, for the past two quarters, the iPhone has been the best selling smartphone brand in mainland China.

Screen Shot 2015-06-22 at 1.55.02 PM

With the premium market sealed up by Apple, the real battle moves to the middle-income parts of the market. Tim Cook made an interesting statement last quarterly earnings call when he stated the iPhone was beginning to penetrate the mid-tier parts of the Chinese smartphone market. This correlates with some recent survey work we did in China where over 50% of those considered in the middle-income bracket expected to spend more money on their next smartphone. This is where the battle will lie for vendors in China. With the most developed parts of China already at 90% smartphone penetration, any meaningful growth by any vendor in mainland China will come from taking customers away from someone else. For the time being, this favors Apple but there are over 50 smartphone brands who sell into mainland China. However, only four brands rank among the most owned across all income classes–Apple, Samsung, Huawei, and Xiaomi.

Consolidation is likely coming in the China smartphone market as it will be difficult for all 50+ brands to continue to do well in the mid and premium price tiers. Any smartphone vendors looking for pure growth must look below the $100 device range and many are not positioned well to succeed there. While Apple is among those well positioned to grab new users from Android brands, Meizu and Oppo are brands to watch as well. Xiaomi was hot for a while but has now seen two quarters of back to back declines and we will see how 2015 pans out for Xiaomi in their home country.

Lastly, another data point that makes China interesting from a growth standpoint for well-positioned brands/vendors is that Chinese consumers replace their smartphones on faster cycles than any other market. The average US consumer refreshes their smartphone every 26 months while the average Chinese consumer refreshes every 22 months.

This is a picture of the market as it is today, but there are new dynamics coming to the Chinese smartphone market which may shake things up in an interesting way. In a similar vein as the US, the Chinese government is mandating all credit cards and retail store point of sale kiosks move to dual-purpose cards. These are cards not unlike the chip and pin cards coming to the US market but using different technology and including the secure element. These kiosks coming to point of sale will include both the RFID dual-purpose chip and an NFC chip which means there will be significant infrastructure for contactless mobile payments in many developed areas and the larger Chinese retailers by the end of 2015. I hear nearly every Android OEM is going full steam with NFC in China as well as OEMs and mobile payment companies starting to put the pieces together to compete for mobile wallets and mobile payments. Of course, if Apple can secure the right deals with UnionPay and others, they will also be right in the mix as the Chinese market ripens for mobile contactless payments via smartphones. Everyone I talk to at the component and hardware level who focuses on China believes another competitive cycle is coming from OEMs to capitalize on this new dynamic of mobile payments.

What’s perhaps most interesting about the smartphone hardware market in China is how it is moving more toward a premium market. Thanks to Apple, ASPs in China are actually growing not declining. Remember most believed the way to be successful in China was to make low-cost/cheaper handsets, but the market is actually moving up and this is true across income brackets. I’ve plotted estimates for ASP in China compared to that of the US to show this.

Screen Shot 2015-06-22 at 6.15.51 PM

All these dynamics make China quite unique. It is becoming the largest premium smartphone market and I don’t see that changing anytime soon. It is the largest smartphone market with over 600m smartphones in active use, and the vast majority of those 600m smartphone users are looking to spend more on their next handset and simultaneously are investing more in the Chinese mobile internet and contributing to local economy. You can see why this market is so important to many competitors due to its size but for Apple it’s crucial to their growth. This is why we are seeing and will continue to see significant investments and customizations with Apple’s hardware, software, and services specific to the China market. To compete in China, hardware, software and services core competencies are becoming essential. Which is why my sense is there are only a handful you can tough it out.

Soon I’ll do a deep dive on the Indian smartphone market. India in terms of potential user size will rival China, but as you will see dramatically different market dynamics exist.

The Myth of a Tech Bubble and the Future of Investing

Benedict Evans and the team at A16Z got their hands on some detailed data on venture capital dating back to pre-2000 bubble days. There are clear indications shown in the data to deflate the current tech bubble narrative, but even further implications for both the public and private equity markets.

This Time is Different

There is a core economic theory, which I’ve used as the basis of my anti-bubble argument, called the “Boom, Bust, Buildout” theory. I wrote about it at more length here, but the argument uses history to show how many of the largest industry megatrends started with a bubble. Eventually, the bubble burst due to an influx of capital without a sustainable or mature market size to return the needed ROI on the capital. As the market matures and the large customer base required to sustain the economic growth models of businesses emerged, the bust is followed by a gradual, yet much larger, growth period which dwarfs the initial bubble in total size. This point is captured in two slides from Benedict’s charts.

Screen Shot 2015-06-16 at 10.11.26 AM

This slide shows the market sizes of actual internet users during the bubble times compared to where we will be by 2020 with nearly four billion people participating in the internet economy. This slide shows the unsustainable amount of capital per actual Internet user going back to the bubble days.

Screen Shot 2015-06-16 at 10.21.08 AM

There simply weren’t enough humans participating in the internet economy to justify the amount of capital being invested per user to be sustainable. The investment per user balanced with the total market size seems much more sustainable now. The market size is four times larger than in 2000 and heading to eight times larger by 2020. Bottom line, there wasn’t really a market ready for the amount of tech investment in 2000. There is today and it’s only getting larger by billions of users, not millions.

From Public to Private

Perhaps one of the most striking shifts has been the delay in public IPOs. Part of this has to do with the ease of acquiring large amounts of money from venture capital firms. However, I also believe it is in part due to the recognition of the pressure put on public companies for short-term growth by Wall Street. It seems the short quarter-to-quarter mindset is more prevalent than the long view now more than ever with many influential public equity funds. This I believe will have an impact on the companies who do or don’t IPO in the coming years.

Screen Shot 2015-06-16 at 10.37.41 AM

Assuming this trend continues, the world of private equity starts to get quite a bit more interesting. If growth is slowing and harder to come by for public companies, then I see two fascinating dynamics.

The first is how we can view venture capital as distributed R&D for larger public companies. If these private companies are not going to IPO, then investors get liquidity via acquisition. Therefore, there is a strand of thinking which must exist as VCs look to do investments from the POV of who may want to acquire the company. Similarly, big public companies may look to be aggressive with their venture arms to make strategic investments as well as strengthen their relationships with top performing VC firms.

The second is around public/private large-scale investors. If you are a large-scale investor, the public hedge funds are starting to look less interesting. There is slowing growth with many public investing hedge funds, but less risk. Many of these investors will be looking for slightly more risk but higher rewards and those investment opportunities have moved to venture capital. This risk balance is why so much money is being poured into later funding rounds in today’s venture capital economy. Once a company has proven itself by way of its business model, market position, growing customer base, or any range of metrics, the money starts pouring in. Which, as a function to itself, makes it unnecessary for a company to go public to raise money. It also fuels the shift for limited partner funds to be more aggressive with their investments in VC firms vs public hedge funds as a percentage of their investments.

Screen Shot 2015-06-16 at 11.10.13 AM

Large-scale investors who used to be aggressive with the capital they manage in public markets must now shift some or more of their focus from public investing hedge funds to VC funds. Which suggests VCs are very much the new hedge funds, at least for the time being. VCs are the gateway to the private companies where nearly all the growth, risk, and reward is happening.

This has the potential to impact the VC world both positively and negatively. I’m hearing of new VC funds popping up left and right with starting funds in the $60-150m range. This is likely not sustainable as these new VC funds are being entrusted with capital to return an ROI. This is hard and takes special skill sets. While times are good to raise VC rounds, the pressure will be higher to deliver.

The trend line is clear. We are not in a bubble but are in the midst of one of the largest global technology build out phases in history. What we are observing in size, scale, and economic upside may rival the industrial revolution. How public companies via M&A, as well as private and public investors, capitalize on this growth will be a fascinating dynamic to watch.

Apple’s Growing User Base

One major thing stood out to me as I listened to Apple’s earnings report and earnings conference call on Monday. Apple is continuing to grow their base of users against all odds and this question will remain central for many: “Can Apple continue to see record growth quarter after quarter?”

There seems to be little question it will happen for a little while but, as the narrative goes, Apple will run out of new customers and the company will just be selling products to existing customers. Personally, I land here every now and then. After all, there are only so many people on the planet who can afford a $700 smartphone. Yet Apple’s base does continue to grow and, given how very few come into the Apple ecosystem only to leave at some point, this is a key storyline to track.

Several points stood out to me to indicate headroom for Apple to continue to grow.

  1. Android Switching. Apple made a point to call out Android switching as a key quarterly item of interest. Tim Cook stated:

    “We’re seeing a higher rate of people switching to iPhone than we’ve experienced in previous cycles…”

    I have survey data from China in Q4 that asked those who bought an iPhone what device they replaced. 26% said they replaced an Android phone. That was higher than any other response, including other versions of iPhones. Globally, the same survey data indicated 16% of iPhone buyers switched from an Android phone.

    Interestingly, there is also strong data suggesting that the iPhone gained share in the US as a percentage of quarterly upgrades. While over 30% of buyers in Q4 indicated they upgraded early, there was still some expectation that holiday quarter demand would trend into Q1. However, both AT&T and Verizon posted weaker upgrade figures than expected. Both were essentially flat YoY. This could have meant that the US would be weak in quarterly numbers and jeopardize iPhone sales getting to the 60m mark. With Apple hitting 61m iPhones in the quarter, it suggests that, not only was iPhone growth huge outside of the US, but that Apple also likely took the vast majority of share in US upgrades.

  2. First Time Buyers. While I can’t imagine this was a huge percentage of quarterly iPhones, Tim Cook mentioned that some iPhones were sold to first time buyers. From survey data, I saw that 5% of iPhone buyers in Q4 2014 were buying their first smartphone. Even if this number is 2-4m, it is a significant data point. Apple still has some opportunity with the ~10 of US mobile subscribers who don’t yet have a smartphone. A similar story exists in parts of Europe. Other markets may be tougher to get first time buyers, given most of the new user growth will come from the low end of the smartphone market.

China

Another key part of Apple’s big picture narrative is China. I made mention of the China Android switching statistic but Tim Cook also said Apple seems to be getting out of just the high end and into the mid-tier in China as well. To give you a picture of the iPhones in use in China, I’ve updated my usage data from Baidu, but added two changes for perspective.

With the 5s and 5c, and iPhone 6 and 6 Plus, Apple has been releasing two current generation phones. So rather than break each out in this China data, I added the iPhone 5s and 5c together and 6 and 6 Plus together. I did this to show how the narrative that Apple needed a lower-cost smartphone to penetrate China played out. In fact, they launched a more expensive iPhone and saw a greater trajectory in China.

Screen Shot 2015-04-27 at 10.33.21 PM

As you can see, not a lower cost iPhone but a more expensive one is yielding unprecedented trajectory for iPhones in China.

To cap this point off, Apple sold more iPhones in China than in the US for the first time. I thought this may happen in Q4 2014 and it was quite close but, on the back of the Chinese New Year, we modeled this to happen in the March quarter with near certainty. Here is the chart from my model on iPhone sales by volume in China and the US.

Screen Shot 2015-04-27 at 10.37.34 PM

China continues to be a growth area for Apple. They are gaining switchers from Android and trending along with the rising middle class. There are ~100m iPhones in use in China and ~500m Android phones. As the size of the Chinese middle class trends upwards, so will Apple’s upside as more consumers in the 500m Android user base grow in economic status and aspire to the iPhone.

These are some of the key points of Apple’s continued momentum in 2015. Tim Cook also highlighted that only 20% of the iPhone installed base has upgraded to iPhone 6 and 6 Plus. Interestingly, he gave a “low teens” number last earnings call. Many of us assumed 13% is low teens. So this quarter, only 7% of the base upgraded. There is a great deal to unpack with this statistic in the future but the larger point is a large percentage of the iPhone base is still poised to upgrade. This number, combined with new user growth via first time smartphone owners and Android switchers, makes the core global bull case for Apple in 2015.

We still need to dive into iPad’s struggles, the iPhone’s prospects in other emerging markets, Macs growing in China, and Apple Watch data over the next quarter. Stay tuned.

How the Apple Watch Solves “The Wearable Dilemma”

It has been well documented that the current crop of wearables, mostly those in the health and fitness category, suffer from a steep rate of abandon after a period of time. Reports last year said more than half of the wearables purchased by US consumers were not in use after 12 months. It seems consumers find the initial experience novel for counting steps, calories, and other features depending on the band, but after a period of time, they lose interest. One of my working theories is these devices also offer little value beyond basic step, counting, heart rate, etc., and don’t help the owner make sense of the data or even evolve in their goal setting. Whatever the case, there is overwhelming evidence the current crop of wearables are not compelling enough for the vast majority of their owners to continue using them. Here is an excellent chart from Morgan Stanley research of US wearable owners and how long they have used the device after a length of time. As you can see, less than 10% of owners still use the device after 12 months.

Screen Shot 2015-04-16 at 8.23.34 AM

My initial thinking around what Apple should do in this category was to nail the health and fitness part since those devices are the ones selling in some volume, with estimates of approximately 20m in 2014 worldwide. So it seemed there was an opportunity and interest. My theory was Apple should release a wearable that was the best health and fitness device and not a general purpose smartwatch/wearable. However, after using the Apple Watch for more than two weeks, I’m convinced this initial thesis of mine was wrong.

I have to admit the health and fitness aspects of wearables have limited appeal to me. More specifically, there isn’t a product with a health and fitness angle that has given me good reason to care about it yet. I like the Workout application on the Apple Watch quite a bit. I do run and train for competition tennis so I do like being able to track set distance or time goals using the app. But the general activity tracking of the Apple Watch, while comprehensive, is not the feature I value the most. Yet I’m certain it will be to my wife.

The broader point in all of this is how the health and fitness aspects alone don’t seem to be a feature compelling enough for the mass market to continue using it. This is where I think the general purpose nature of the Apple Watch is what is going to help it break the current pattern of wearables. In my experience, it is the diversity in the value propositions the Apple Watch offers that makes it compelling enough to keep wearing. If all it did was health and fitness, I wouldn’t keep it on all the time. I’d likely wear it when I exercise but that is all. Because it offers a range of other value propositions from notifications to glances of useful information to health and fitness to apps to the fashion of it, I’m more willing to keep using it. The applications will also continue to expand the use cases making it even more compelling and sticky. It also happens to be extremely comfortable, more so in my opinion than any other wearable I’ve tried, which also makes it easy to keep it on.

When you think about the paradigm shift I mentioned in my Apple Watch review, that of the Watch being an interaction model measured in seconds rather than minutes or hours, it brings up an interesting observation. If i’m only interacting with this product for a few minutes every hour, then why should I keep it all on the time? Here again, it is the convenience of the additional use cases for glance-able information, but also the promise of the diverse value propositions.

On this point, I did notice an interesting new behavior with the Apple Watch I’ve never experienced before with any other wearable. If I take it off during the day to charge, or for any other reason, I miss it.

Video: Computing Platform Journey

Sorry it has been a while since my last podcast. I recorded a 13 minute video using Perspective, of a high level deck I have been giving to execs and investors lately. This is the culmination of a lot that has been on my mind lately. If you have an iOS device I strongly recommend watching this from that app on iPad or iPhone. You can also pause the recording and interact with the charts yourself. I also left a few extra charts in there, that I did not speak to, and you can swipe forward and interact with those charts as well.

Here is the direct link for the story in Perspective. If you don’t have the app or just want to watch the video, it is below.

[fluidvideo url=”//player.vimeo.com/video/121473322″]

Report: Apple’s Unprecedented 2015 in China

With Chinese New Year upon us, I thought I’d focus on some observations on China related to smartphones and particularly Apple.

Apple’s growth in China has been modest but steady — until Q4 of 2014. Apple saw a more than significant increase in Chinese sales during the December quarter as evidenced by their revenue from the greater China area.

screenshot_2015-02-12_18.34.55

We may look back at Apple in China and view their presence there as “pre-iPhone 6 and 6 Plus” and “post iPhone 6 and 6 Plus”. Without question, the years prior to the 6 and 6 Plus were about laying the foundation for their strategy in the region. This included the opening of 17 stores to date (40 within the next few years), the localization of iOS for specific regional needs in China, the addition of all their major carriers including China Mobile, and the support of Union Pay for iTunes. All of these things were essential for Apple’s foundation of their ecosystem in China. Now that the groundwork is fully laid, we are seeing Apple’s presence in China take shape.

There has always been strong demand for Apple products in China but not for Apple’s ecosystem. Consumers there were getting iPhones largely on the grey market, jailbreaking them, and not investing in the Apple ecosystem. This was a risky proposition from a loyalty standpoint. Despite the allure of Apple’s brand, their longevity to succeed and grow in China is helped by the stickiness of their ecosystem. Ultimately, Apple does not want to just sell hardware to Chinese consumers. Yet that was what was happening prior to the things I outlined above and all based on the high appeal from an aspirational viewpoint of Apple’s brand in the region. However, things are changing and it appears the China ecosystem is gaining traction as well.

Now that Apple’s base in China has become large enough, local developers are realizing the same things many Silicon Valley developers already know — iOS is a better place for developers to monetize. The dynamics I have continually explained, that Apple has the most desirable customers who are willing to spend, drives this. Local app developers, and even local services companies, commerce companies, etc., are starting to cater to iOS customers in ways they previously haven’t before. While this is trend is still in the early phases, there is a shift on the horizon. Some of it has to do with China’s maturing consumers but it seems there are dynamics at play which are bringing iOS into its own as a desirable software platform and ecosystem. Meaning, Apple is appealing to Chinese consumers beyond just hardware and brand. This is key.

This chart shows the history of iPhones in China by usage. Prior to the ecosystem foundation, iPhone 4 and 4s (largely acquired by secondary and grey market sales) dominated usage. But now the entire shift is happening to new devices with deep ecosystem ties (jailbreaking is now less than 10%. It was over 50% at one point in time).

Screen Shot 2015-02-17 at 8.49.59 AM

Competition

Highlighting three frequently talked about brands in China tells some key stories. Samsung once dominated China and their rise and fall is a useful case study specific to global strategy. Similarly, Xiaomi’s rapid rise to number one in China is another telling case study of regional success. As you can see, Apple’s trend line has remained steady in terms of sales in China for iPhones.

Screen Shot 2015-02-17 at 10.30.33 AM

Samsung’s fall from number one in China to number five took just over four quarters. Similarly, Xiaomi’s rise from lower than the top five to number one took just over four quarters. Apple’s rise from the bottom of the pack to #2 took one quarter. Apple will very likely take the number one spot in the March quarter thanks to the Chinese New Year.

It was hard for many who did not study China to understand the massive upside Apple has in the country. Looking at every region we study, I’m not sure I can say this about any other area other than China at the moment. Apple will certainly increase their base in the US, possibly getting to 60% share, but the US has only a little over 300m people. The number of consumers in China Apple can likely appeal to is double that number and growing.

While the revenue chart above still shows US and Europe ahead of China, China will likely continue to grow and get closer to US. The US remains, in the short term, Apple’s largest market by revenue even though, and soon, China will be the largest market for iPhone sales.

China could be the Apple Watch’s largest market day one. I have quite a bit of luxury watch market data for the China region and while a huge number of very cheap watches get sold there, a large number of very expensive watches get sold there as well. The Apple Watch lines up with China’s gadget craze, particularly around mobile, and Apple’s aspirational brand appeal, all which lead me to believe the Apple Watch will not only sell well in China but will drive demand for iPhones even higher. I do believe the ASP of Apple Watch sales will be higher in China than any other country.

Some possibilities for Apple in China in 2015:

  1. Apple could sell more smartphones in China than Samsung
  2. Apple could be the number one or number two smartphone vendor in China for all of 2015
  3. While possible but somewhat doubtful, Apple could see China revenue be higher than the US towards the end of year (driven by Apple Watch revenue
  4. Apple could average more smartphones sales in China than any country (it will be a back and forth between China and the US in 2015)

The last point I want to make with regard to Apple in China in 2015 is a look ahead toward the end of the year. I have a feeling that, when the current iPhone 6 and 6 Plus get discounted in China to the $500-$600 range, whether through primary channels like carriers or secondary/grey market channels, Apple will see iPhones compete with smartphones in the $300-$400 range in China. This means those customers who may have spent $300-$400 may consider an iPhone 6 or 6 Plus in the $500 range within reach and continue saving. If this happens, Apple’s customer base could increase dramatically as the $300-$400 price range sees, on average, more than 40m shipments per quarter in China.

As our readers know, I update and share my data models for China regularly and Apple’s line in 2015 will be interesting to watch. Tim Cook mentioned on the last analysts call that many didn’t think they could do it in China. There is a similar narrative about Apple in India. While it is true the dynamics in India are completely different, I believe it is time to start focusing more on India and what Apple’s upside may look like there as well.

Report: The Smartphone Market in 2014 and Beyond

Fascinating things happened in 2014 with regards to the smart phone market. Two striking ones from my predictions article happened in Q4 2014 rather than in 2015 as I predicted. I hedged my bet saying they could happen in Q4 2014 and, sure enough, they did.

Smart phone vendors sold more in the December quarter than the PC industry has ever sold in an entire calendar year. Apple also passed Samsung as the number one smart phone vendor in sales in the quarter as well. Both, in my opinion, were inflection points on the entire mobile industry and have striking implications going forward. Before diving into the takeaways, I want to walk through a number of data points.

Installed Bases

On of the things I work hard to track is the installed base of smart phone platforms. Here is my chart breaking down the installed base of each current platform.

Screen Shot 2015-02-02 at 5.26.08 PM

As we have been tracking this over time, you can see how Symbian essentially got eaten by Android. AOSP has been on a steady rise, thanks to China, and has an installed base slightly more than the iPhone’s. Blackberry continues to lose customers but may likely hold steady and normalize at some point.

Another interesting way to look at this is to show YoY growth.

Screen Shot 2015-02-02 at 5.48.10 PM

As you can see from a platform like AOSP, when you start from very small numbers and grow fast, you achieve huge YoY growth. But as your share size increases, the growth begins to normalize. I visualize this data this way to see what patterns may emerge. While Android and Apple are holding steady, we are still watching AOSP normalize. Given AOSP’s total addressable market is really only China for the time being, it is likely to hit a stopping point at some time as China becomes saturated. This growth chart will highlight that when it does. Windows Phone has modest gains annually, enough to keep their line in the positive but, in terms of size, we are talking very small numbers. I measure this YoY using a year ago quarter to track growth.

The last way I like to slice my installed base data is as a platform’s percentage of the installed base by quarter.

Screen Shot 2015-02-02 at 5.53.05 PM

The point is we are seeing a normalization pattern among the major platforms. Android continues to add modestly, as does AOSP, as does Apple. What makes Apple’s installed base interesting, however, is the continued growth from hand-me-down devices and the secondary market. By my installed base estimates, about 66% of all iPhones sold to date are still in active use. This can only be achieved by making products that last long enough to get handed down to family members or sold again in the secondary markets of China and India. All of which is a contributing factor to Apple steadily growing their active user base.

Quarterly

Quarterly snapshots give us equally useful views of the market. For this we need both a global picture and a regional picture. First the global view.

Screen Shot 2015-01-28 at 8.23.14 PM

As everyone knows by now, Apple sold more smart phones than anyone else in the quarter. While I don’t chart feature phones, it is interesting to note that Apple became the second largest phone manufacturer as well. Samsung was number one — selling ~95m phones, both smart and feature phones. Apple was #2 overall with 74.5m. Microsoft/Nokia came in at number three at 50m. It is a historic moment as the market rapidly transitions from feature to smart phones. While it is fun to appreciate Apple beating Samsung in Q4, we know it will be short lived as Samsung will be back in the top spot in Q1 2015 and likely sell in the 65-68m range. Apple will likely be in the 57-58m range but could possibly hit 60, largely driven by the Chinese New Year. I’ll update my Q1 2015 estimates closer to March.

Key Regions

I’d like to provide a snapshot of a few key regions broken down by smart phone vendor and by quarter. Let’s start with the US.

Screen Shot 2015-02-02 at 6.38.43 PM

The US has always been Apple’s largest market and this quarter they followed a similar pattern — gaining over 50% of quarterly sell through into the US market thanks to the holidays. Apple’s share of the postpaid market was well over 60% and their share of premium smart phone sales was over 70%.

In China, the number one vendor crown was very close between Apple and Xiaomi. So close we will again see analyst firms disagree on this. However, they all will agree it is close. I am able to see some live network data from Baidu/Umeng, which is a challenge because I see how many iPhones, roughly, are active but not all are sold just in China. Some are purchased or imported from elsewhere but still end up on the network. I’ve created a model to help balance this by using what I believe the percentage being imported vs. bought locally is using a range of data points. Based on this model, I have Apple as the #2 smartphone vendor in China but very close to Xiaomi. Here is my chart.

Screen Shot 2015-02-02 at 6.45.59 PM

With Chinese New Year coming, this quarter will be fascinating to watch. I’m fairly confident Apple will sell more smart phones in China this quarter than in US for the first time. They may also be the number one smart phone vendor in the region and, this time, it may not be close.

Samsung continues to have significant troubles in China despite being a top 10 brand in the region. Xiaomi also posted their first QoQ decline largely due to the larger iPhones. A key storyline I am watching in China is Motorola. Lenovo moves decent volume in China, but they are perceived as a lower end brand even though some of their hardware is quite nice. Motorola fits nicely into a higher price point, more in line with some of the Oppo and Xiaomi mid-range offerings. All our research continues to show significant interest in foreign brands. Chinese brands are having trouble moving upstream in the market and selling smart phones at higher priced tiers. This creates an opportunity for foreign brands. The key point is that, while ZTE, Huawei, and Xiaomi have their eyes set on international expansion, brands like Apple and Motorola are looking to gain share in the region.

Lastly, India. Other than strong continuous growth, India’s picture has not changed very much. Samsung is still the number one vendor, and Micromax is catching up. Apple is slowly but surely climbing but it is very slow.

Screen Shot 2015-02-02 at 6.57.40 PM

Where do We Go From Here

As we look at where we are today, we have to also make some points about where we are going. As I pointed out in my column yesterday, it is clear Apple is getting a near lock on the most profitable segment of the market. As Samsung’s strategy becomes clear, we will cover it for subscribers but the trend lines are not favorable for them to recover much, if at all, in premium. With all the future smart phone growth coming from lower end devices, the next phase of mobile is going to look nothing like the first. These markets will separate and it is unclear what the picture looks like for the next two billion smart phone users. To illustrate this, I’ve created this chart.

tiers

This chart is a picture of the current 2 billion smart phone owners. What I’ve done is illustrate the smart phone platform share of the current price tiers. However, at the bottom I have left it intentionally open to highlight that the battle for the next two billion smart phone users is anyone’s game. Certainly Android could grow to fill that gap or maybe it will be an Android fork or alternate platform like Cyanogen. Perhaps Windows Phone is positioned well for the next few billion. Or perhaps something out of left field like FireFox OS. What’s clear is if there is an opportunity for a third OS the opportunity exists in the gap pictured in my chart.

The majority of smart phone’s sold and in use at the end of 2014 were in the mid-range and high end price points. Increasingly toward the end of 2014, we saw an acceleration in phones costing less that $200. Which brings this nugget from ABI Research into light.

seq

Why did Android smart phones decline? My answer is because the market for smart phones above $200 is drying up. The next phase, as we get out of tier 1,2, and 3 China and into the rural villages, will demand smart phones much cheaper than $200. Similarly in India, getting past the nearly 200m smart phone owners in the region and into the next phase of growth will happen with much lower cost devices. We are in a slight pause, as we look to re-accelerate growth as very good, low cost devices enter the market. Sometime in 2015, we will likely cross the 400m mark for smart phone shipments in a quarter. And this will be the new normal as we near 2b smartphones sold in a single year. To see how we believe that plays out, I’ll leave you with my chart on smart phone price tier forecasts. We will soon be living in a mobile first world.

Screen Shot 2015-02-02 at 8.03.31 PM

A Potential Surprise in Apple’s Earnings

Everyone is focused on iPhone sales numbers and rightly so. It’s going to be a historic and unprecedented quarter for Apple’s iPhone. However, there is a data point I’m very interested in I think may catch some folks by surprise.

We continually emphasize Apple’s ecosystem as the foundation of the their strategy. Sales of end devices is central for the ecosystem, but where we can measure the Apple ecosystem is in iTunes software and services revenues. We know Apple’s increasing payouts to developers. We know App store revenue is increasing but the services side is what intrigues me.

We see overall revenues from iTunes continues to grow.

screenshot_2015-01-26_09.28.42

Which means, as Apple grows their base, these consumers spend money on apps or services in their ecosystem. Selling devices and growing services revenue have to go hand in hand for what Apple is building to be sustainable.

Apple is also continuing to grow grow their base.

Screen Shot 2015-01-26 at 8.38.27 AM

This is my model of the iPhone installed base. As you can see it continues to grow. A primary reason for Apple’s continued installed base growth is hand-me-down devices and the secondary market in areas like China and India where consumers buy refurbished iPhones through secondary channels. The point is, as Apple’s user base grows so does iTunes software and services revenue. These are key points to watch. However, I think in Apple’s earnings call tomorrow revenue from software and services may surprise some folks.

My belief for this is based on the new addition to iOS 8 around iCloud storage. Pricing varies by region slightly but the basic new offerings are 20 GB for .99c per month, 200 GB for $3.99 per month, $9.99 for 50 GB per month, and $19.99 for 1TB per month of storage. I was quite optimistic about the upside of these services when they were first announced. Many on the financial side modeled modest uptake of these cloud storage monthly services but I think uptake was more than most anticipated.

From some initial consumer research we performed in several markets from US, Europe, China, etc., we found percentages ranging from 15% up to 30% who said they opted for a monthly iCloud storage plan. The .99c option was the most popular. This appears to be driven largely by the need for more storage for photos and cloud backup. It is no secret consumers take a massive amount of photos with their iPhones. But now they are taking more photos with burst mode, more video thanks to slo-motion and time lapse, and all these new innovations around the iPhone’s camera take up more storage. An interesting way to look at this is how Apple’s innovations around the camera essentially drive the need and value of the iCloud storage plans.

The December quarter is usually already a big one for iTunes software and services thanks to the holiday season and many getting App Store gift cards as presents. However, with the addition of the iCloud pricing plans, we may see a surprising number come from this area in Apple’s earnings call.

Tech Devices Owned in 2014

>As we enter 2015, I wanted to give our readers a look at some of my survey data highlighting the percentage of ownership by specific tech products as of the end of Q4 2014 from our research panel. Since we do research panels quarterly on a range of topics, I’m setting the stage so we can look back throughout 2015 and beyond to see how the data changes with time.

First, a note on methodology. While respondents to the survey could take the survey from their smartphone, tablet, and even featurephone, the vast majority of respondents took the survey from their desktop or notebook PC. This panel went out to over over 40,000 people with larger volumes of respondents in Western countries. I have data for over 30 countries but I’m focusing on certain markets for this post. For each market, I’ll share the chart and make a few observations. But overall they are self explanatory.

Question: What devices do you personally own?
*Smart TV was defined as a TV that could access the Internet
*Smart Watch was defined by using examples like Pebble, Samsung Galaxy Gear, Sony Smartwatch
*Smart wristband was defined by using examples like Nike Fuelband, Fitbit, Jawbone UP
*Tablet was defined by using examples like Apple iPad, Samsung Galaxy Tab
*Smartphone was defined by a phone with access to an app store, browser, maps, email, etc.

US/UK
Screen Shot 2014-12-31 at 5.02.50 PM

This panel was to over 27,000 respondents in the US and UK. In both these markets the PC, smartphone, and tablet percentages closely align with actual penetration of each device. I have a high degree of confidence the other categories represent the general penetration as well of the US/UK market based on retail and sales data I have.

I expect moderate growth of both the smartwatch and the smart fitness band products by this time next year in the US and UK market. The PC will likely remain flat and may actually decline and I do expect the tablet percentage to increase.

China
Screen Shot 2014-12-31 at 5.42.33 PM

China requires some context for this data. This panel had 4,700 respondents. The percentages do not line up with the penetration of core computing devices. So we have to take that into account. PC penetration is about 35% in China and smartphone penetration is nearing 50%. What we take away from this panel is the mix of device ownership by the online population, a group that can generally afford a range of gadgets and a group where PC penetration is quite high. This is why, within this group, the smartwatch percentage is quite high. In fact, of every country surveyed, China had the second highest number of respondents who said they personally owned a smartwatch.

While an important segment to understand, this data represents a picture of tech device ownership of the top 30-35% of the China market. This picture would look different if we just researched the lower tiers where a smartphone is likely the only smart tech device they own.

India

Screen Shot 2014-12-31 at 5.52.45 PM

The India panel had 3,100 respondents. Much of the same context of the China market applies to the India market. Only here, we are looking at the top 20% of the market. PC penetration in India is around 10% and smartphone penetration about 9%. Smartphone penetration is growing rapidly in India and, in Q4 of 2015, smartphone penetration will likely double and be near 20% or higher. It was interesting among these respondents that smartwatch ownership came back so high. Granted, we are polling the higher tiers of the market so their disposable income and ability to afford multiple tech products is higher than the overall Indian market.

Japan
Screen Shot 2014-12-31 at 6.01.10 PM

I’m including Japan because I’ve always found it a particularly interesting market. This panel covered just over 2,000 respondents but again has similar penetration rates of PCs, smartphones, and tablets. The tablet never took off in Japan the way it has in other markets, and the smartphone amazingly didn’t take off as fast as I thought either. This in the context of how fast Japan has been in the adoption of other leading tech categories. I’m very curious to see how the Apple Watch does in Japan. We know the Japanese have an affinity for Apple products and tech/gadgetry in general. While Japan is not on any lists I have seen as a big market for the Apple Watch, I think it may be a sleeper market.

I gather data points on these markets and many more and use them to round out my analysis on each region. But, as a starting point for our readers, I wanted to start with some of the specific device ownership data and keep updating models throughout 2015 as key observations come to light. Obviously, the smartwatch is a key category I’m observing and will continue get data on from each key region.

The Danger of the $200 PC

There have been rumors of the return to netbook pricing in the PC market. We believe this could have an irreversible impact on overall PC prices. When we study the PC market, we see a high degree of health in the higher end segments of the market. Companies like Apple and other vendors who have legitimate premium offerings have secured their slice of the PC pie with a sustainable hardware strategy. Our concern on the Windows front is, if the price of Windows PCs drop significantly, those price points will become the “new normals” and eliminate any real chance of premium offerings by other Windows PC vendors. Currently, the ASP of notebooks is approximately $700 and desktops approximately $550. But those high ASPs are because of Apple’s Macs. The ASP of a strictly Windows PC is about $430 which is about as low as a full featured Windows PC has ever been (excluding netbooks). At that price, it is already difficult for many Windows OEMs to make much money on hardware. They are all currently looking for more software, services, and accessories revenue as a point of emphasis.

Competing with Apple is hard enough for vendors in the Windows ecosystem. A significant drop of ASP will likely eliminate any chance of premium offerings by them. There will still be an enthusiast Windows community but that community is already quite small. The build-it-yourself PC community and the hard core PC gaming category, while extremely healthy, are still too small to sustain the ASPs of the entire Windows PC market. So as of right now, this is a look forward forecast of the ASPs of certain categories.

Screen Shot 2014-12-11 at 9.44.28 PM

However, given this article I posted a few days ago on low cost tablets, I’m already due to update my outlook for tablet ASPs in 2015. Should the notebook and desktop space truly become a race to the bottom, then I will have to adjust the 2015 ASPs of notebooks and possibly desktops to trend more into the negative than I think is healthy for the category.

Part of the drive to bring down the ASPs of PCs is to kick start the broader upgrade cycle in consumer markets and perhaps compete more with tablets in the entry level PC space (first time PC/tablet buyers). There is some sound logic to this. However, with “good enough” computing established in these markets, the concern would be that nearly the whole market would gravitate to these lower cost PCs and cause a sweeping shift in price points to the lower end where margins will be even further squeezed for the OEMs. Overall, our concern is the destruction of the “value and premium” segments of the market with “good enough” options being offered in the <$400 PC market.

Using my viewpoint of what happens with low cost tablets in consumer markets, I feel it would be smarter if vendors left the bottom to those tablets and focused on features and functions that will remain “valued” by end users. I can see a scenario where consumers start to gravitate to desktops in their homes instead of notebooks. They can use the tablet or their smartphone as their mobile PC and pair it with a desktop for their fixed PC usage. Due to the lengthy refresh rates, our research indicates consumers would spend more on these PCs because they intend to hold onto them because they want to them last longer than previous upgrade cycles. Those who need notebooks because they are traveling or are mobile workers will still utilize and spend on the product because of its value to them from a productivity standpoint. Bottom line, I believe there is still money to be made in PC hardware if Microsoft and the vendors can avoid letting certain players collapse the ASP of the PC category. Should the race to the bottom happen, even those who would pay more because of the intrinsic value the PC provides will no longer have to since they can get the same features as mid and even high end PCs at rock bottom prices.

Eventually, I can see the PC market going one of two ways. Either it becomes a race to the bottom and only a few current vendors are left standing or value can remain in the category. Ultimately, it is up to Microsoft and the Windows OEMs to decide which future they want.

Data: The iPhone 6 vs. the 6 Plus in China

Internal data I have access to from Baidu in China allows me to see a picture of what is happening at ground level in terms of daily active users by device on Baidu’s network/app distribution platform. Baidu is the largest search engine in China both by use and revenue and their app distribution platform represents over 50% of the app distribution share and is growing. This data comes from analytics of devices that are accessing Baidu’s app platforms, not their search engine. They point out this data covers over 600m users.

There are a number of key takeaways from the most recent October data that relate to the iPhone 6, the 6 Plus, and the iPhone 5c.

First let’s look at the chart:

Screen Shot 2014-11-20 at 6.38.46 AM

When the iPhone went on sale in China at the end of September, it showed up on Baidu’s network at 0.9% of active use of all iOS devices. The 6 Plus didn’t show up at all. At the end of October, the iPhone 6 registered 2.6% of all active iOS devices and the 6 Plus 1%. Obviously, this suggests there are more iPhone 6s being sold in China than the 6 Plus–for now. Speaking with friends and colleagues in the region, it appears the shortage of availability of the iPhone 6 Plus is one of the major factors for this. I had several of them tell me customers were waiting more than a month, sometimes two, just to get their hands on the 6 Plus they ordered.

Knowing what I know about the region, I assume this will balance itself out and the anticipated 50/50 to 60/40 6 Plus to 6 split in China mix will play out. While I can’t quite use this data to interpret sales volume for these iPhones in October, I can use other means to estimate it in the coming months.

While these data points are interesting and I will continue updating this chart every few months, the uptick of the iPhone 5c may be the most interesting story line. As you can see from the chart, the iPhone 5c maintained a relatively steady flat line. But over the past few months the iPhone 5c has been gaining share in China. This seems to be counter to many of the assumptions of China as only a super premium market for Apple. Many were quick to point out the 5c was not targeted at China and thus expectations for it were tempered. However, things may be starting to change for the 5c and I believe there are a few reasons why.

One thing you realize when you study Chinese urban, and in particular, youth culture, is sometimes certain things/trends take a little while to make an impact in China. Many trends which start out global do not hit China and go big overnight. When I talked to some fellow researchers in China about this, a point was made that for the youth culture (who we believe is the source of the uptick in 5c sales) certain trends need to be established as culturally cool before they buy into it. It seems this is the common wisdom on the ground in China with regards to the 5c. It was not viewed as cool initially, since it was the “cheaper” iPhone but influences from metropolitan areas like Hong Kong have helped change the initial perception and it has become acceptible as an “entry level” iPhone. More succinctly, the 5c took a little while to be viewed as culturally acceptable since it is/was not the premiere iPhone.

If you read what I wrote about Xiaomi and Apple, you will recall I said Xiaomi’s phones are viewed as a cultural symbol for a young person who is upwardly mobile or moving up in society. From some dynamics I can see around the 5c, it seems it is also perceived now in a similar light as Xiaomi’s phones as a cultural status symbol. It helps the iPhone 5c is now also much closer in price to Xiaomi’s phones, especially the Mi4, with the heavy discounts coming to the later generation device. Given the iPhone 5c has a limited shelf life and no similar product was released last year, this dynamic may not last forever. However, I have a feeling once the iPhone 7 line come out and the iPhone 6 and 6 Plus are discounted in the region, we will likely see even greater penetration of iPhones in the exact same markets Xiaomi is looking to capitalize on. But, for the time being, it is interesting to see the dynamic of the 5c starting to play into the middle smartphone price tier of the Chinese market where Xiaomi has and continues to be quite strong.

There is one more important data point for the iPhone in China this report tells us. It relates to jailbroken iPhones. The number of jailbroken iPhones has been steadily decreasing. This is part of the reason why UnionPay being supported is a big deal. As I studied behavior of jailbroken iPhone users in China, the heaviest of whom were on the iPhone 4 and 4s, it became clear those who jailbroke their devices were not investing in Apple’s ecosystem. Which would have been a concern to Apple’s overall China strategy.

The Baidu data shows us since the 5s and 5c, the number of jailbroken devices is less than 10% of those devices, and less than 1% on the current iPhone 6 and 6 Plus models. Meaning, more and more iPhone consumers are not jailbreaking their devices and thus investing, to some degree, in Apple’s ecosystem. UnionPay helps this and both are very positive signs for Apple’s ecosystem story.