Something I’ve done after each earnings season is plug all the results from some of the biggest and most important consumer tech companies into a spreadsheet and compare them. Much of my analysis during earnings season focuses on individual companies, but it’s often instructive to sit down and put these numbers side by side. I have seven companies I typically refer to as the “Big 7”, though they’re strictly speaking not the seven largest. They are:
- Amazon
- Apple
- Microsoft
- Samsung
- Sony.
The odd one out is Facebook, because it’s a fraction of the size of these companies, with revenues of just $12 billion in 2014 compared to at least $65 billion for the others. But it’s included because, of all the smaller tech companies out there, it feels like the one that has both the greatest potential and the broadest reach into our daily lives. Its base of users is on par with, if not ahead of, the rest of the Big 7 which is why I include them even though their size doesn’t justify the name.
What I’m going to do here is run you through just a few of these comparisons, with some commentary. As a special freebie for Tech.pinions Insiders, I’m also going to embed the full set of charts I send to those who subscribe to my quarterly decks service. We’re looking for a way to make these decks available to Tech.pinions as an additional tier also, so watch this space.
Revenues
First off, revenues. This is the best measure of the scale of these companies and what becomes very apparent from the chart below is there are three distinct tiers within this group:
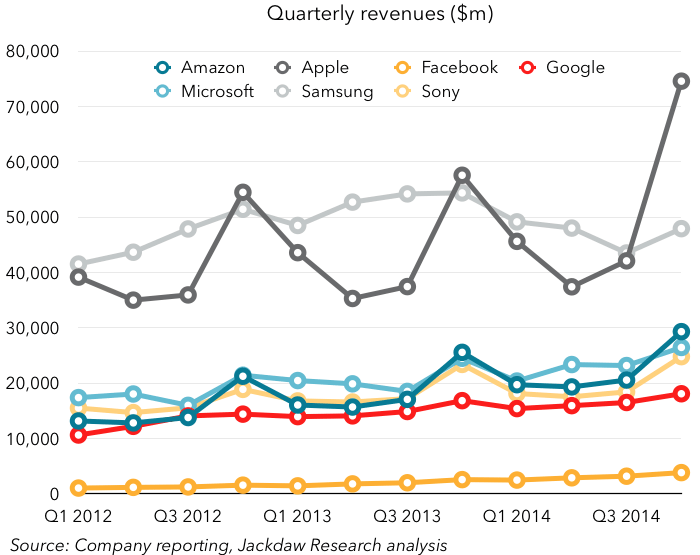
The top tier is Apple and Samsung, which jockey for position throughout the year as the largest by revenues. On an annualized basis, Samsung has been the larger of the two for the last several years, despite Apple’s monster fourth quarters. But in 2014, Apple finally pipped Samsung, thanks to its massive Q4. The second tier is made up of four companies with annual revenues between $60 and $95 billion: Amazon, Microsoft, Google and Sony. Facebook brings up the rear, with far lower revenues. Two other things worth noting are cyclicality and trajectory, with the former sometimes making the latter hard to discern. Only some of these businesses have highly cyclical revenues, with Apple perhaps the most dramatic, having huge spikes every Q4. But Amazon, Microsoft and Sony have pretty dramatic Q4s too. Even Google and Facebook have bigger fourth quarters driven, in their case, not by holiday sales to consumers, but by higher ad spending in Q4, which in turn is intended to drive higher Q4 spending by consumers. The only company which is not notably affected by seasonality is Samsung, which has such a broad range of products across its various consumer electronics and appliance categories it sees a pretty steady flow of revenues throughout the year.
Trajectory is harder to see but the chart below shows year on year growth rates:
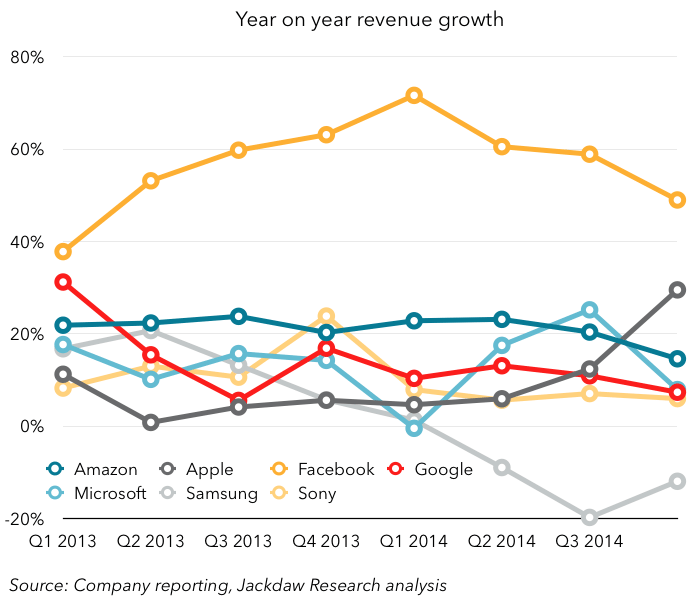
Two things stand out to me: Facebook’s massive faster growth rate compared to all the other companies (though it appears to be slowing), and Samsung’s dip into the red. But, if you look closely, you’ll see Apple had a significant move in the last couple of quarters, from low single digit year on year growth to 12% growth in Q3 and over 20% growth in Q4. Meanwhile, Amazon’s growth has slowed over the past couple of quarters and there’s no discernible trend in the other companies’ revenue growth.
Profitability
Profitability is another way in which Facebook justifies its inclusion in this elite group because it’s one of the most profitable companies in consumer technology. There are various profit metrics you can use to measure this, but let’s focus on net income, the true bottom line:
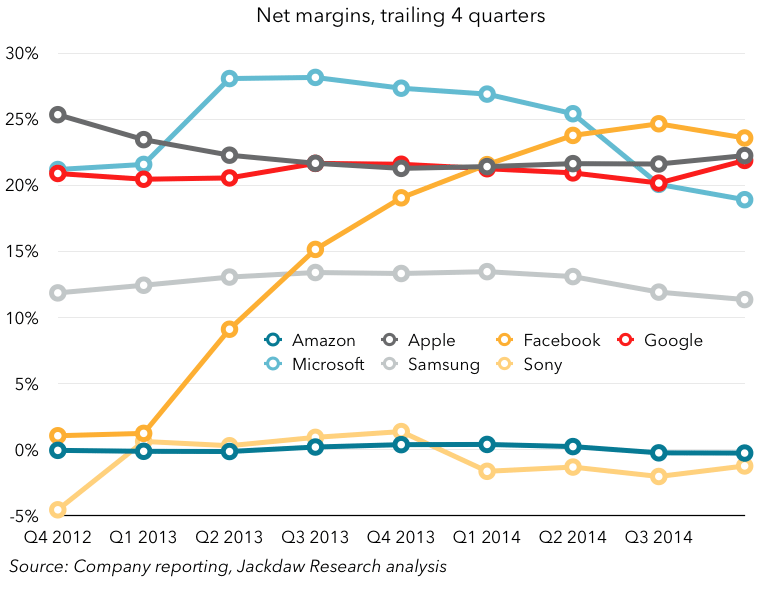
As you can see, Facebook was the most profitable of these companies over the last two quarters in margin terms, even at a time when Apple was generating record net income dollars. Apple, Facebook, Google, and Microsoft are all clustered very close together around 20-25% margins (Microsoft’s was easily the highest before the Nokia acquisition). Samsung’s margins have never been as high, but have also dipped significantly in the last few quarters, dragged down by the mobile business. Sony and Amazon, meanwhile, compete for the “least-profitable” crown. While Amazon’s low margins are ostensibly the result of an intentional business strategy, Sony’s are the result of several businesses in turmoil and transition, but the result is the same: very low margins. What’s impressive to me is Facebook has rocketed so quickly to margins similar to those at the very largest consumer technology companies without the same scale benefits – it’s clearly a very different business model. But it’s also likely to see continued declines as it absorbs Oculus and WhatsApp, two businesses with minimal revenues today, but fairly significant expenses. Though the chart above focuses on percentage margins, it’s instructive to note Facebook’s $5 billion in operating profit in 2014 is greater than Amazon’s entire operating income dollars for the last nine quarters combined.
Business models
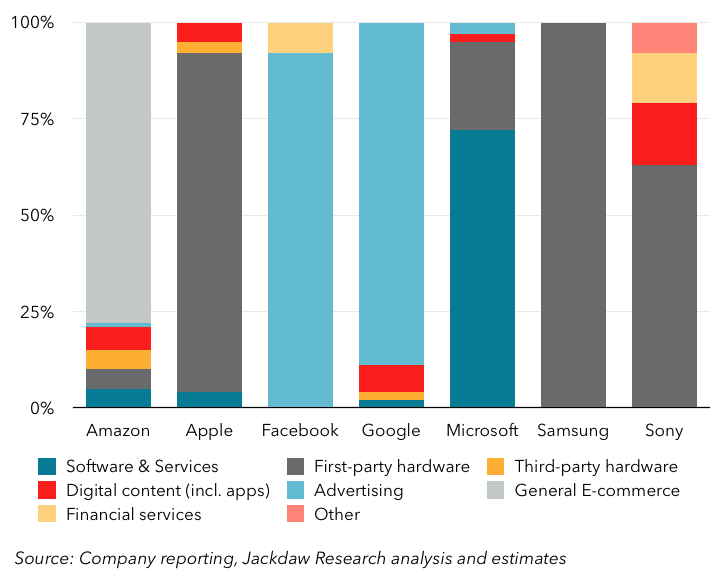
The last thing I want to touch on is business models, which vary enormously between these seven companies. I’ve created eight broad categories of products and services to characterize these companies’ revenue streams and the chart below shows an estimated breakdown of their revenues over the past year by these eight categories:

What you get is some broad themes:
- Facebook and Google’s revenue is equally dominated by advertising, at around 90%, though the source of the rest of their revenues is quite different. Facebook is deriving just under 10% from its legacy payments product, while Google derives the rest from the Play Store, Nexus devices and enterprise revenues.
- Apple, Samsung, and Sony derive a majority of revenues from hardware, with Samsung’s dependence on hardware starkly illustrated in the chart, while Apple and especially Sony have much more diverse businesses. Apple’s other revenue is, of course, very closely tied to its hardware revenue, while Sony’s is in many cases entirely disconnected — a major part of its ongoing struggles.
- Microsoft and Amazon are unique, with the former deriving most of its revenues from software and services, and the latter from general e-commerce. However, these two companies and Google each have a growing revenue stream in enterprise cloud services hidden in these various categories.
These business models, as I’ve written about before, have far-reaching implications in terms of profitability, the ability to differentiate, tensions between users and paying customers, and so on. They also have implications for the revenue these companies generate per employee, which varies enormously:
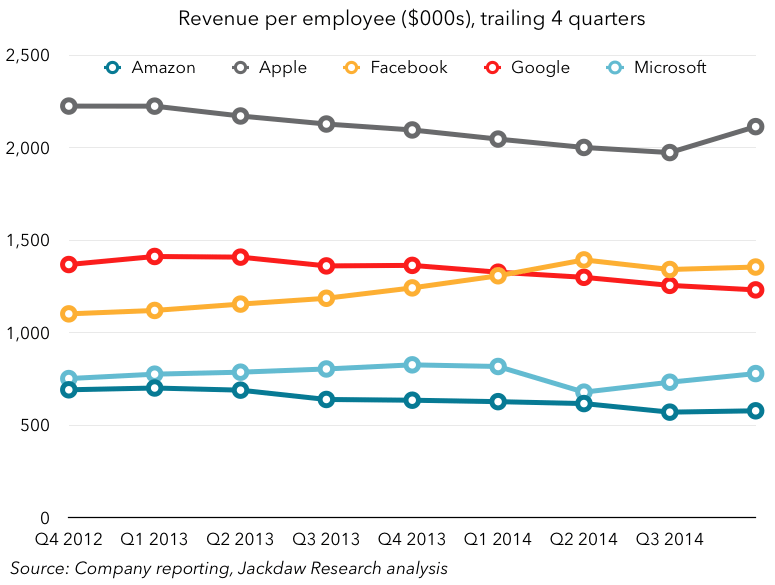
Much of the difference, of course, is driven by the kind of employees these companies hire. Many of Amazon’s employees are stockpickers working in warehouses, while a great majority of Apple and Google’s (edit: non-retail) employees are highly trained engineers, commanding the best salaries. It’s also interesting to see Facebook and Google, which have very similar businesses, generating very similar revenues per employee, though Facebook has now eclipsed Google. It’ll be interesting to see if that trend continues.
More charts in the deck below
Below is that deck I mentioned at the beginning – there are quite a few more charts in here if you found the ones above interesting. I do this on a quarterly basis for my clients.
Jan, about “a great majority of Apple and Google’s employees are highly trained engineers”, not quite for Apple. In “Apple Corporate”, maybe so, but 46,200 (nearly half) of Apple’s 92,600 FTE (non-temp, non-contractor) employees are in Retail as of FY 2014-end (10-K, pg. 8)
Quite right – the majority of the non-retail employees at Apple are engineers, but as you point out there’s a very large number of those retail employees.
Good Article! Though the 2 blues and 2 yellows force the viewer to go to the legend a lot. Just a suggestion but when you update them, might want to try a green and brown.
It’s nice to see the best quality content from such sites.
Superb post however I was wanting to know if you could write a litte more on this topic? I’d be very grateful if you could elaborate a little bit more.