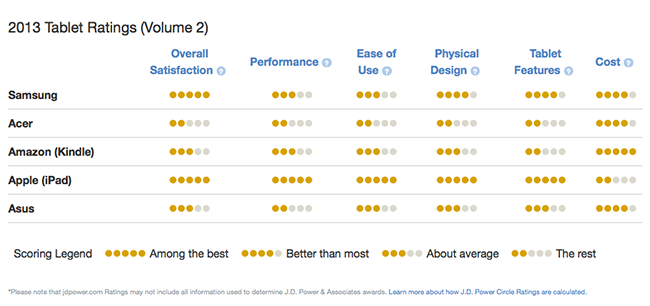
 J.D. Power caused a bit of a stir today when it put out a new survey in which Samsung had displaced Apple as the leader in U.S. tablet satisfaction. While the headline of the McGraw-Hill Financial unit’s press release declared “Samsung Ranks Highest in Overall Tablet Customer Satisfaction with Tablet Devices,” the featured table (above) seemed to tell a different story: Apple outscored Samsung in every category except cost.
It gets even stranger when you drill down a bit. J.D. Power weights each of the categories for importance: Performance 0.26, ease of use 0.22, physical design 0.19, features 0.17, and cost 0.16. The unweighted average of Apple’s scores was 4.4 to Samsung’s 3.6. Weighted, Apple outscored Samsung 4.52. to 3.52.
So how did Samsung come out on top? According to a J.D. Power spokesperson, the flashy “Power Circles” chart doesn’t really have much to do with the overall satisfaction. Rather than try to explain this, here’s the relevant section of the email I received in response to my inquiry:
Thank you for your interest in the 2013 U.S. Tablet Satisfaction Study–Volume 2. It’s important to note that award is given to the brand that has the highest overall index score, not the company with the most Power Circles. In this study, the index score is comprised of customer’s ratings of five key dimensions or factors.
The Power Circles Rankings are something we provide to consumers to understand the relative rank of brands within each of these five dimensions. The Power Circle Rankings denote the brand that has the highest score within each factor regardless of how much higher their score is.
In the case of Apple in the tablet study, although it did score higher on four out of five factors measured, its score was only marginally better than Samsung’s. At the same time, however, Apple’s score on cost was significantly lower than that of all other brands. In comparison Apple’s ratings on cost was more than 100 points lower than Samsung’s. As such, even though its ratings on other factor was slightly higher than Samsung’s, Apple’s performance on cost resulted in an overall lower score than Samsung.
In this cost-conscious environment, cost is a key factor in many products purchase and services they use. Tablets are no exception, where cost is a key driver of the overall customer experience with their device. Although “cost” has the lowest weight among the five factors that drive satisfaction, the notable difference between Samsung’s and Apple’s score in the cost factor was enough for Samsung to rank highest in the study.
Mathematically, this does’t make much sense. Apple outscored Samsung by two “power circles” in each of two categories with a combined weight of 0.48 and by one circle in each of two categories with a combined weight of 0.36. Samsung outscored Apple in one category with a weight of 0.16. Unless the score difference between two circles and four is much, much bigger than the difference between three and five–in which case the whole circles chart is grievously misleading–there is no way Apple’s loss on cost could outweigh it winning in the four other, more heavily weighted, categories.
J.D. Power does not reveal the raw scores by category, but gives Samsung’s overall satisfaction score as 835 (out of 1000) and Apple’s as 833. Curiously, Amazon and Asus, which received only three circles for overall satisfaction, had scores of 826 and 821–only a 1.8% spread between first and fourth place. Asus–two circles–was a fairly distant fifth at 781.
I don’t put much stock in J.D. Power ratings, but they do get used heavily in advertising by whatever company comes out on top. If people pay attention to this sort of “data,” they should be getting more transparent methodology.
I don’t think anyone is owed a more transparent methodology, actually. Their worthiness as a source of evaluation should be based on their past record and not on the formula, which itself is determined subjectively. I’m comfortable with their explanation and sympathetic to the displeasure being aimed at them.
Really? Obvious and glaring confusions. They do not trigger the need for transparency? Why hide the raw results?
Because there embarrassed to publish them.
They have severe egg on there face and are too proud to admit they made a horrible mistake.
I just don’t think JD Power is required to be transparent. Publishing the results is a tacit consent that they have to justify their methods to you, and to me, and to her, and to him, and that guy over there, and to this guy over here, and to that CEO and to that soccer mom and to that congressman. All those people may represent multiple variations on what’s fair.
They have a formula, they use it to rank things, you either find they have credibility or you don’t. It’s no different than evaluating tech rumors, or ratings on Yelp or Amazon, or EPA mileage estimates. Each of these things, if you dig down, has an element of subjectivity, whether it is the context-sensitive opinion of a consumer, or a decision to use a particular mathematical methodology. You’re surrounded by suggestions from other people that come from different perspectives than yours!
As far as this being obvious and glaring, I disagree. Distilled down to the message, the “circles” do not equate to points or specific point ranges. They are not “score between X and Y and get three circles.” They are reflective of where a company stands among the others in the study. Everyone may get 9 or 10 out of 10 in one area, but SOMEONE is going to get 1 star and SOMEONE is going to get two stars and SOMEONE is going to get three stars, etc. Using the circles to try to extrapolate the results is incorrect use of the data.
I do agree that it is confusing without further explanation: and they gave that explanation.
The following is an edited version of a comment of mine posted elsewhere on the internet under a different user name:
“In a capitalist world, you get what you pay for. A great tablet…for a price; a great survey…also for a price. The former can henceforth be monetized through creativity; the latter can henceforth be monetized through duplicity.
Pure conjecture based on business model and past behavior, but Samsung, as a prospective user of JD Power services, would gladly open up the vault to get a Samsung-skewed overall result out of a credible consumer survey on tablets. So slightly skewed, so finely granular however that no one could reasonably call it foul play without incurring public derision, and utter dismissal, from the feel-good commentariat and punditry.
A simple question. What proportion of Samsung’s massive PR and Advertising budget will be allocated on promoting these two apparently minuscule, but actually larger-than-life, percentage-points advantage over Apple’s iPad?
In this case, circumstantial evidence overwhelms legal circumspection. Samsung direly needs to turn the tide in the public perception of the iPad. They have a clear motive for disinformation, an unbounded advertising/PR budget, as well as an abundance of institutional vectors more than willing to carry across spheres and blogosphere of influence galore, some shake-down of Apple’s reputation. And a history of deleterious activities for good contextual measure.
Indeed. These providential two percentage-points overall lead on Apple’s supposedly mighty tablet offering, as sanctioned by a reportedly well-reputed survey firm, can and will drive a subsequent massive PR and advertising campaign. Mark it as an investment in tablet-as-a-PC newfound credibility for Samsung, at the consumer’s expense ultimately, and a high-yield, low-risk, statistical warping of reality for JD Power.
The latter simply free-rides on Samsung/Google ever increasing greed, chronic insecurity and perennial…Apple-envy. That is branded nowadays as no-holds-barred capitalism; a world within which the purest of intentions must battle it out with greed sycophancy for an honest-day’s pay…”
When you present numbers as factual and accurate, you need to present numbers as evidence, not explanations. Powers presented Samsung as 2 points higher than Apple out of maybe 40 points. The explanation is, in essence, that we needed to be in Powers smoked filled room to understand the scoring. Fail.
IMHO you make many excellent points.
Where I disagree with you is I believe, rightly or wrongly, JD Powers utilizes a system that can bring these type of “they don’t add up” results whenever JD Powers wishes to do so. Businesses and Industries are their customers, not consumers or end users.
JD Powers offers a certain status that few consumers will look beyond if that consumer gives any credence to it at all. But to a discerning purchaser, I believe JD Powers’ conclusions make them masters of 3-card Monte and nothing more.
There formula is severely flawed. Even when you use there own ratings 16% relevance to price (the lowest counting metric in there survey) there is no mathematical way they could come up with the conclusion they did.
So yes they DO owe everyone a valid detailed explanation how they came up with this flawed conclusion.
Steve,
Thank you for this very rational approach to pointing out the holes in the JD Powers “methodology” for their “conclusion.” My use of quotes is definitely meant to imply these are pseudo-applications of those two terms.
As someone who has participated in true research studies, an understanding the methodology is key to any resulting conclusions. Knowing the sample size, participant bias, and many other factors must be identified for findings to be considered valid.
Those factors are universally absent in the kind of surveys done by JD Powers and others. An attempt at an analogy between surveys and research might be this:
A survey is a snapshot, research is a motion picture.
All the best…
I’m an old survey research guy myself–at least it is what my academic training is in.
Sounds like Chicago politics at play: “How many more points do we need to put Samsung on top? What!? A hundred? I don’t care; get them.”
I don’t believe people are buying their explanation.
Anyway good for them if they think they can explain away a bad judgement without transparency.
One minor disagreement with your 1st sentence. The consensus here is that Samsung is “buying their explanation.” ;^)
I bet JDP won Samsung’s dollars because….
JDP’s score on cost was significantly lower than that of all other ratings organizations.
(Just kiddin’)
I think JD Power should rank the BCS, that way I would be assured that the results have been skewed and can’t be explained in plain english. Wait, do they already?
A big thank you for your blog.Really looking forward to read more. Want more.
There is definately a lot to find out about this subject. I like all the points you made