
Earnings season technically isn’t over yet – there are still a few companies reporting their results in the next few weeks. But the vast majority of the big name tech firms have now reported, so I wanted to review for Insiders some of the key trends from what these companies have reported over the last few weeks. Note: I do a lot of analysis of earnings as they happen on my personal blog. I also offer a subscription service which provides lots of charts illustrating financial and operating metrics on these major companies and we’re working on a way to offer this directly as a product for Techpinions readers too.
iPhone puts a big dent in Android, especially in China
I think the most obvious trend that pops out of my analysis of the major device makers’ results is the impact the iPhone had on several of the largest Android vendors, especially in China. The chart below illustrates this:  For most of these large Android vendors, growth rates from Q3 to Q4 this year were significantly worse than Q3 to Q4 rates last year. Lenovo (excluding Motorola) and Xiaomi were particularly badly hit, with most of their shipments in China, but Samsung and LG also saw quarter on quarter declines. Among vendors, only Huawei and Sony managed to weather the iPhone’s impact. At Samsung of course, there are longer term challenges at play but, for most of these vendors, the iPhone accounts for a substantial portion of the impact.
US wireless carriers had a huge quarter for smartphones
Three of the big four US carriers have now reported their Q4 results and each of them saw very high rates of smartphone upgrades. Results for those carriers that reported numbers are shown below: 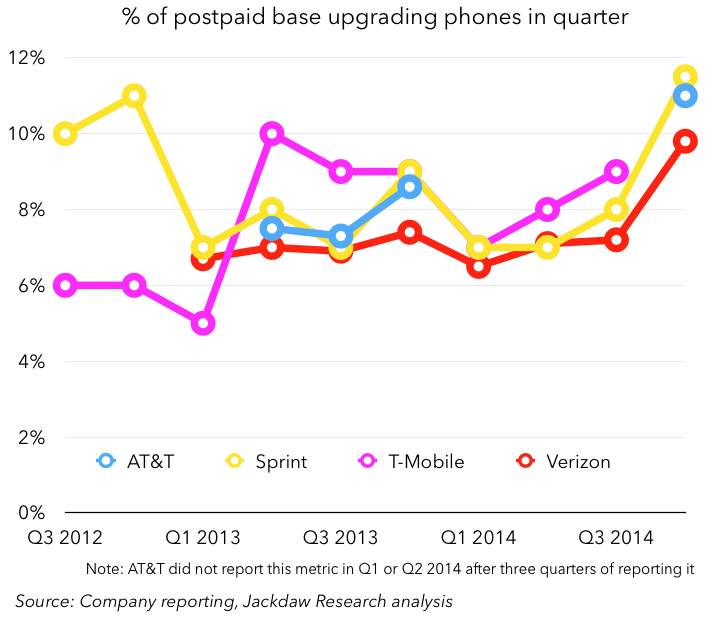 All three of the big carriers have reported a higher percentage of upgrades than in any quarter in the past three years and I would expect T-Mobile to join them. Several factors play into this. The iPhone 6 and 6 Plus obviously drove a big iPhone upgrade cycle, but another major factor was the move to installment-based billing. There’s been quite some debate about whether this new model will stimulate or slow smartphone sales, but this quarter it was a huge factor for all carriers and they all sold tons of smartphones as a result. In Q4 alone, the four big carriers likely sold almost 40 million smartphones between them. Despite this upgrade behavior, however, the vast majority of the subscribers these carriers added in the quarter were not new smartphone lines, but tablets and “connected devices” (machine to machine subscriptions, e-readers and the like).
Social networks battle for users
Facebook and Twitter both reported and shared very different user growth numbers. Facebook, as is customary, reported huge user growth in its core product, up to almost 1.2 million mobile monthly active users. But they also reported significant growth in three other mobile products: Meanwhile, Twitter reported just 230 million mobile MAUs, a number that has barely moved since last quarter (its overall MAU number didn’t grow by much either). These numbers just reinforce the difference in scale and breadth of appeal for Twitter and Facebook in their core products. But this doesn’t tell the whole story. Facebook’s entire product is private and based on being logged in to an account. But Twitter’s product is inherently public. So much of the exposure most people get to Twitter is not through the core service itself but through embedded tweets, hashtags on TV, and so on. Twitter is at a crossroads in terms of its user growth: it clearly believes it can get MAU growth going again, but even if it does, it’s simply not going to be on a trajectory to reach Facebook (or Google) scale. But Twitter’s management seems to believe it can capture another kind of audience that isn’t logged in (and may not even have an account). It already attracts a pretty significant audience this way but it makes almost no effort to monetize it yet. That’s the next challenge for Twitter.
Trends in advertising – Display down, Native, Search and Video up
The last big theme I want to cover is the diverging trends in advertising. I’ll use Microsoft’s results from the Bing business to illustrate this, but the trends are much broader. The chart below shows the proportion of Microsoft’s ad revenue from Display and Search, according to my estimates: 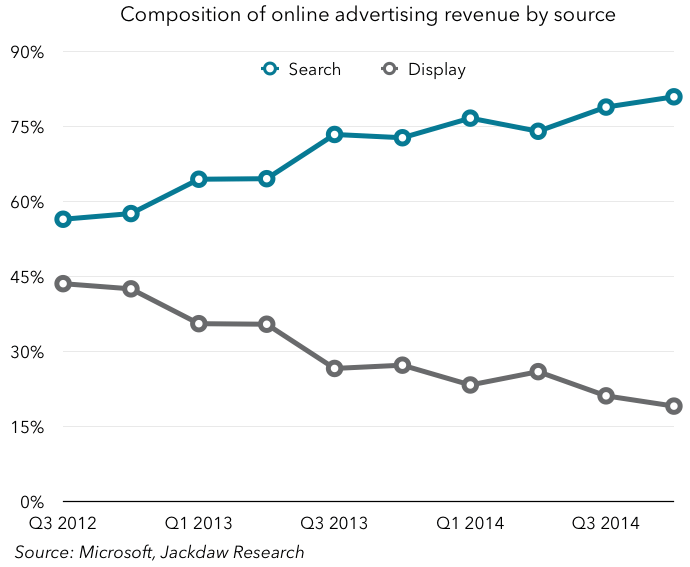 This illustrates the divergence nicely, because this is happening across major companies that play in the advertising space, whether Google, Yahoo, IAC, AOL or whoever. Display ad prices are falling, clicks aren’t growing as fast, and the business is generally performing much worse than other forms of online advertising. Meanwhile, search continues to be a very lucrative business for those who offer it, notably Google (though even there, there are signs of challenges). But the other major growth areas are native advertising, whether at Facebook or Twitter or news sites such as Buzzfeed, and video advertising, which is obviously already a huge business at YouTube, but is also increasingly important at Facebook, which now reports 3 billion views a day. Of course, Twitter and Snapchat both recently announced video products both for users and advertisers, and Instagram has tweaked its video product too. Video will be increasingly important for these companies in generating ad revenue, especially as non-native display advertising continues to suffer.
Illuminating. Thank you.
Is there any comparable data for native ads that can be plotted on the same chart as display and search ads?
Not really, since native ads aren’t really a category in the same way. Pretty much all of Facebook’s ads are native, all of Buzzfeed’s are native, for example. But it’s not a reported category.