
Given all I’ve written about Apple’s reported TV service (and I promise I will move onto a new topic soon), I thought it might be useful to run through some key figures around the economics of the TV business, based on some stats I collect from various companies.
Monthly cable TV bills are higher than many people think
One of the things I’ve seen passed around a lot this last week or two is the size of the average cable bill. I’ve seen two versions of this, both rather misleading when it comes to the actual monthly spend on pay TV for the average American household. One set of estimates has been in the $55-65 range, and I think it is based on some FCC numbers. The problem with that is it only accounts for the content cost and doesn’t include all the taxes, fees, set-top box rentals, etc., and so underestimates the spend quite a bit. The other number I’ve seen is a total “cable bill” number somewhere around $130, but the problem with that is includes broadband and potentially phone costs. Here’s a chart that shows how much money Pay TV providers actually make from their TV services per customer (this includes advertising revenue, so it’s not all direct from consumers):
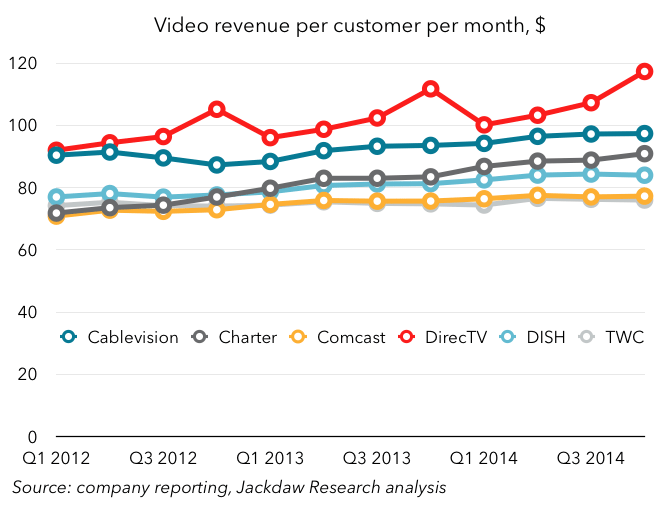
What you see here is that $55-65 is way too low for most providers, with several of these Pay TV providers commanding $80-100 per month, and DirecTV even more. Set-top box rental is a lucrative source of revenue for the cable companies in particular, but it’s something Apple wouldn’t charge (consumers would instead buy an Apple TV box on a one-off basis, or just use existing iPads or iPhones). As such, it is possible for Apple to undercut the Pay TV companies on price, even if it pays roughly the same for content. However, I don’t expect Apple to lead with price – it never has before.
Programming costs are rising, driving up bills
The other thing you might notice from that chart is most of the lines are rising slightly over time. This is due, in large part, to the increases in programming costs Pay TV providers pay to cable and broadcast networks for their content. Not all Pay TV providers report programming costs explicitly, but a chart showing programming costs as a percentage of video revenues for those that do is below:

Again, you’ll see that strong trend up and to the right among all these providers, though the amount they pay varies quite a bit by their size, with Comcast (one of the largest providers, and also a content owner itself) paying the least, and Charter (a smaller cable operator) paying quite a bit more. For all these providers, though, programming costs are roughly 40-55% of revenues. In other words, roughly half of what they make from customers is passed through straight to the content providers. It’s only on the other half of their revenues they have any opportunity to make money, hence the importance of box rentals and the like. For Apple, these costs will likely be at least as high, especially since it will start out with much lower scale than the largest Pay TV providers. It remains to be seen what its model is for paying for content, whether it pays classic affiliate fees or whether it uses a revenue sharing arrangement, but it’s likely programming costs will be equivalent to over 50% of Apple’s revenues too.
The importance of advertising in the TV business model
Of course, not all revenues in TV come from consumers – various parts of the TV industry make money from advertising and it accounts for the large majority of revenue for broadcasters and cable networks. Even the Pay TV providers, which have a significant revenue stream from end users, generate a decent chunk of revenue from advertising, as shown in the chart below:
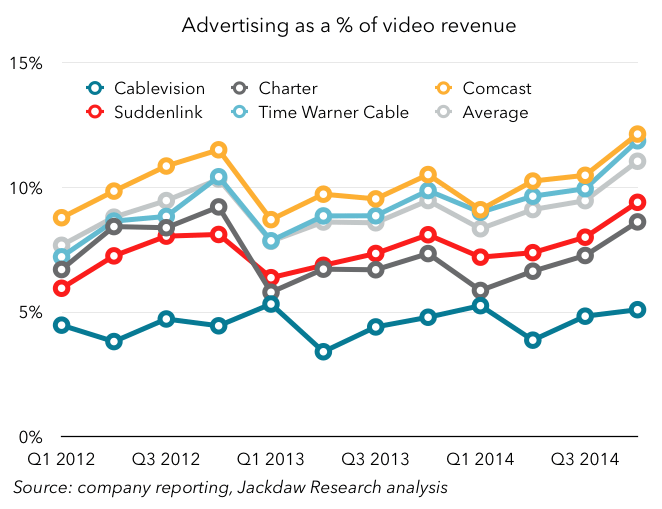
As you can see, 5-10% of cable operators’ revenue comes from advertising. That’s not huge, but it’s not insignificant either. One big question for Apple’s TV service is who will sell the advertising, whether Apple or its partners, and what sort of cut Apple will take. My piece on last week talked about potential roles Apple could play in advertising, but we’ve seen very little detail yet on how this will actually play out.
These charts come from work I do for my clients on the financial and operating metrics for the TV industry. Please contact me if you’re interested in learning more about any of this.
Interesting, thank you.
Prices are incredibly high (ADSL+basic TV+landline+2h of mobile voice w/ulim texts is $30 in France, have to add programming bundles though). I’m always amazed at how often markets in the US devolve into the hugely overpriced, unregulated cartel-ized preserve of a half-handful of companies – if that-.
I’m really REALLY worried the same outrageous rent extraction will happen to our health data and home ecosystem, if lock-in and monopolization occur.
Would be interesting to see Verizon FIOS and AT&T Uverse TV numbers here as well.
They sadly don’t break out the detailed numbers shown above in their reporting, because TV is a small part of a single unit in a much smaller business (versus being the largest part of the business for the cable and satellite providers). I do have lot of stats on AT&T and Verizon’s TV business in other areas where they do report, and some estimates on revenues etc. Just not these specific categories.
http://arstechnica.com/tech-policy/2015/03/trade-group-led-by-att-and-verizon-sues-fcc-to-overturn-net-neutrality/ Draw your own conclusions about their bandwidth capabilities other than FIOS.
Definitely, what a great blog and instructive posts, I definitely will bookmark your site.All the Best!
You’re so awesome! I don’t believe I have read a single thing like that before. So great to find someone with some original thoughts on this topic. Really..