


I thought I would do something different and show some charts and let our readers help interpret them and share thoughts on what the data reveals. I found data from a service called Terapeak that provides a range of analytics for products on Amazon and eBay. Since Jan wrote a great article today on wearables, I thought it would be interesting to look at this data from eBay listings separated by product and revenue generated from each product from sales on eBay. Below are the charts and a few points on them.
Total Listings on eBay
This chart shows the total listings, over the past year, by a few select wearables and smart watches.
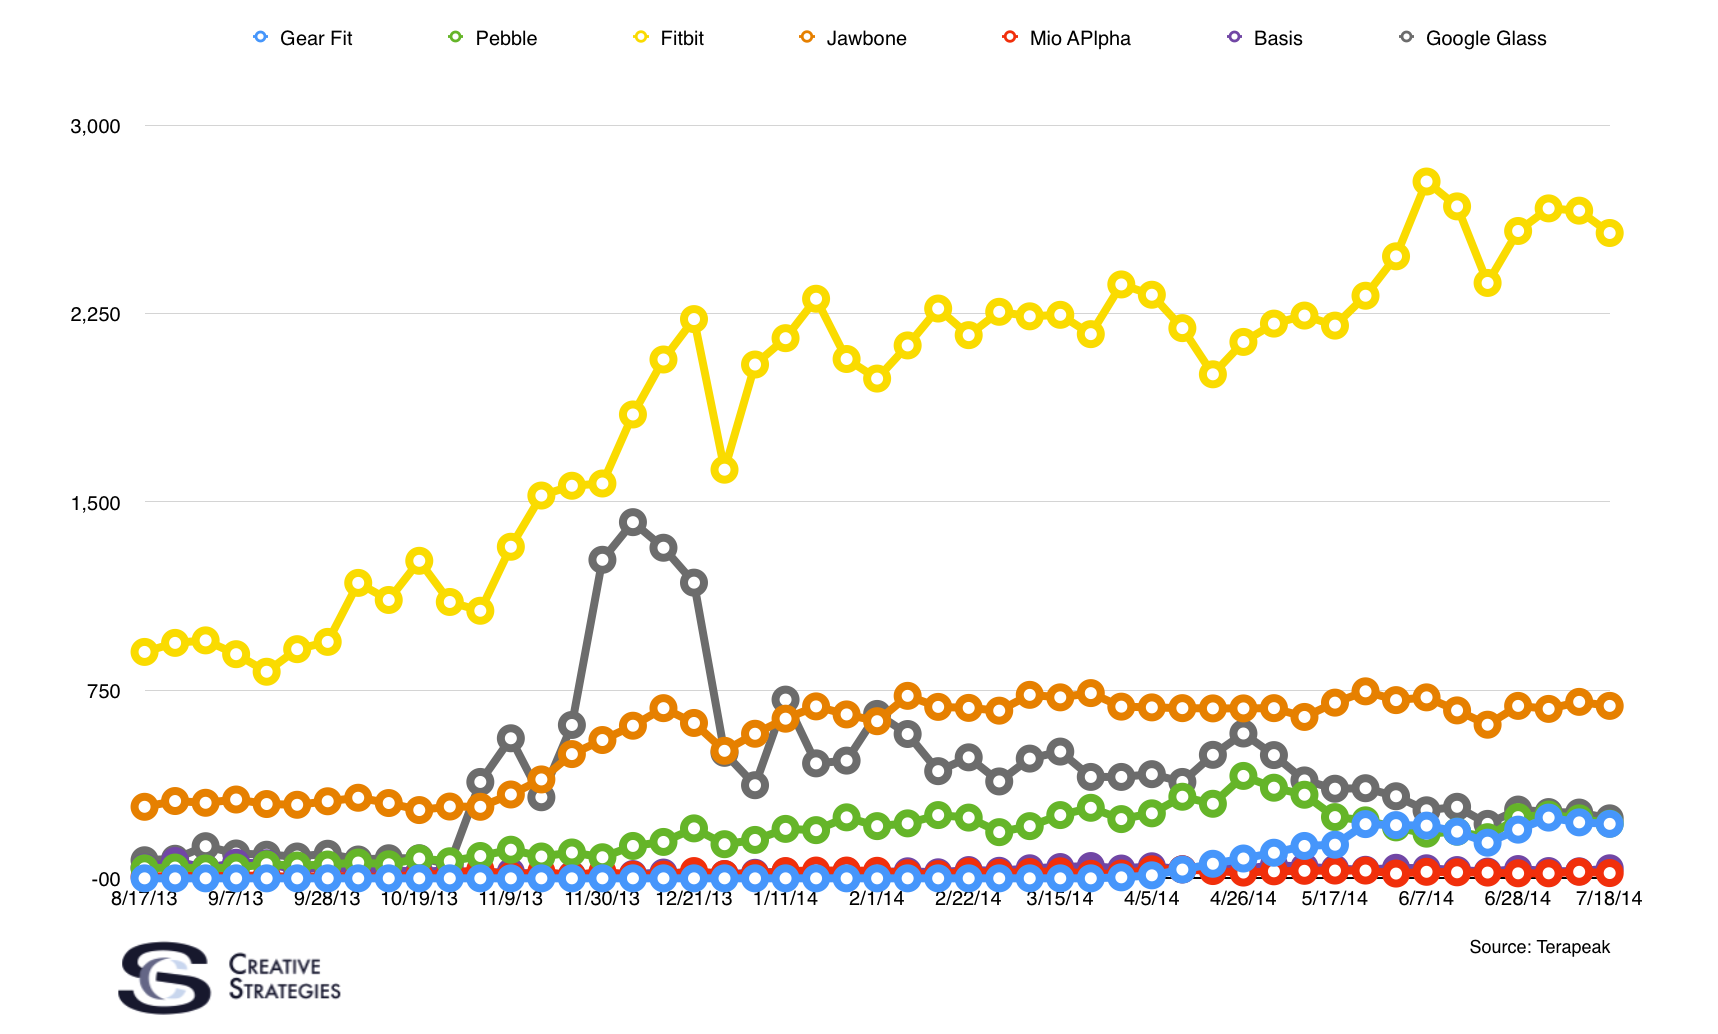
Fitbit has the largest number of listings of any of the devices by volume on eBay. There are a few other data points of interest to note with this chart with regard to new vs used listing for each device.
- Pebble = 30% of listings were used
- Samsung Gear Fit = 8% of listings were used
- Fitbit = 22% of listings were used
- Jawbone = 13% of listings were used
- Mio Alpha = 16% of listings were used
- Basis = 23% of listings were used
Total Money Made by Each Product
This chart shows the total volume in dollars made by each product over the past year.
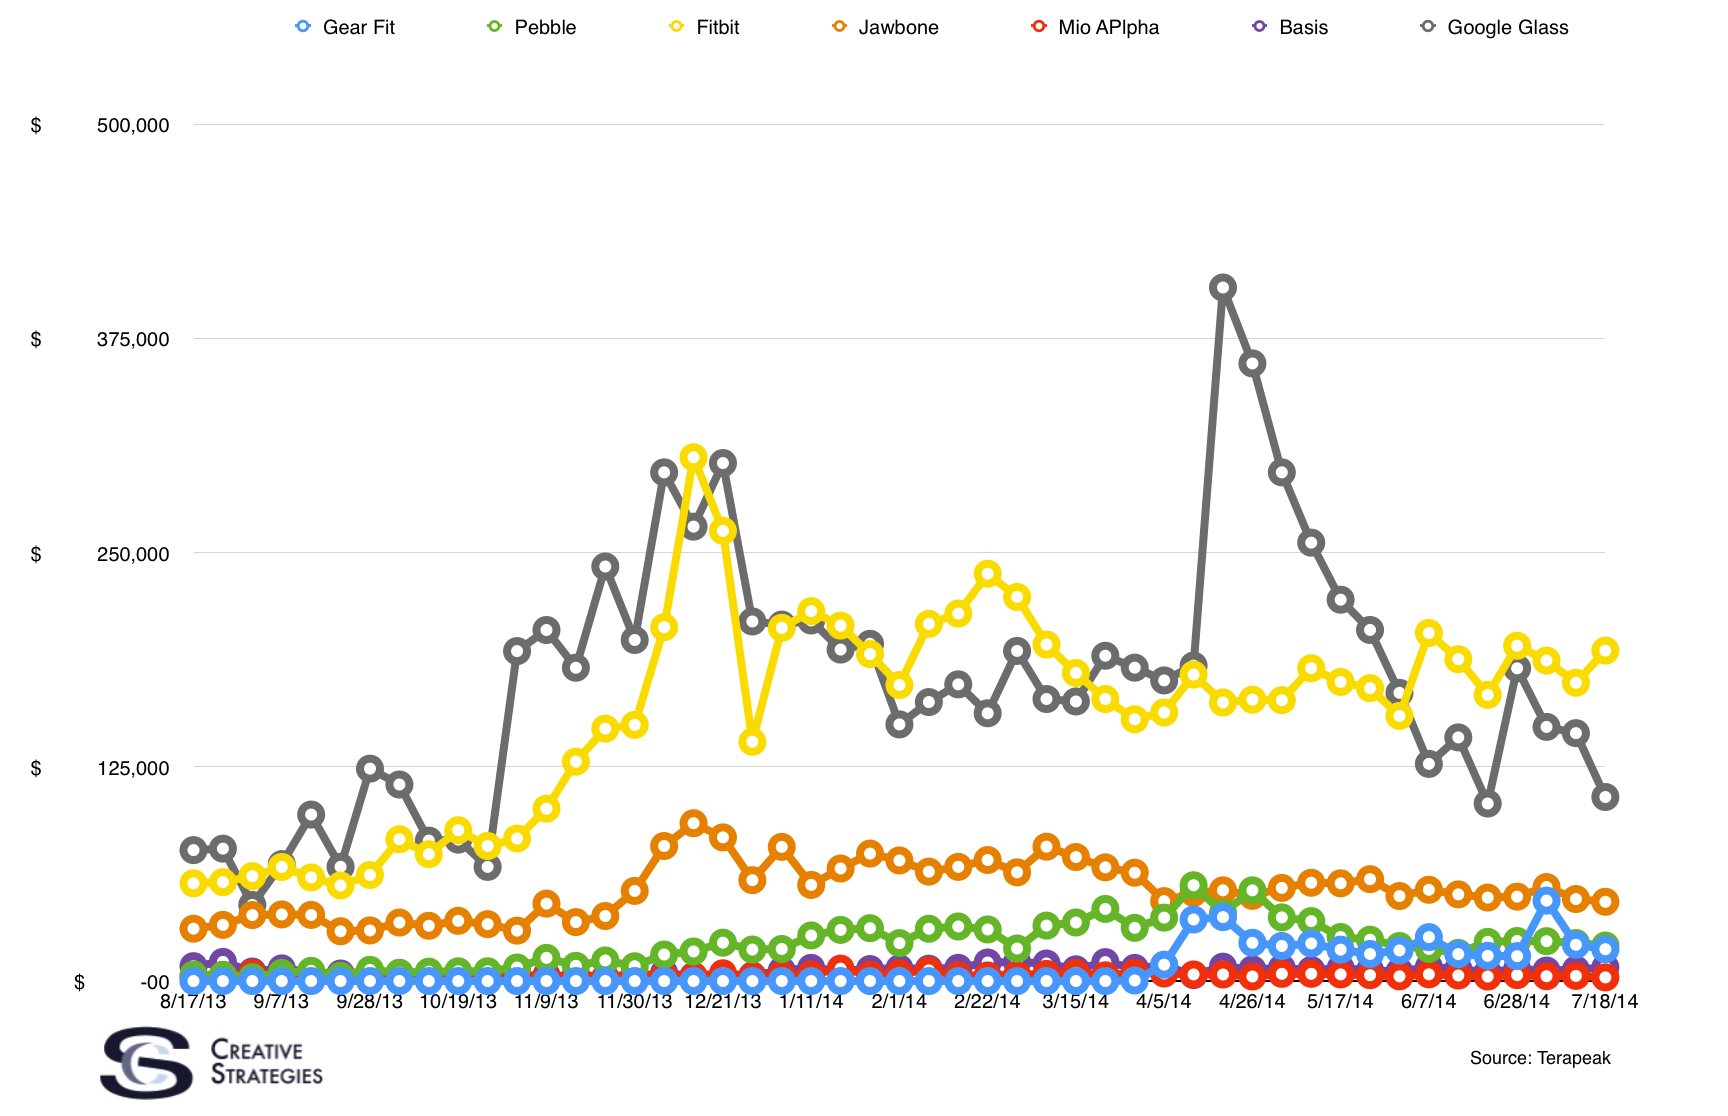
Google Glass is the most expensive of all the products listed here so it should come as no surprise that it makes a good chunk of money from sales on eBay.
Comparing Categories
Just to add perspective, I’ve included the total sales on eBay of the past year’s iPhones, other mobile phones, and tablets.
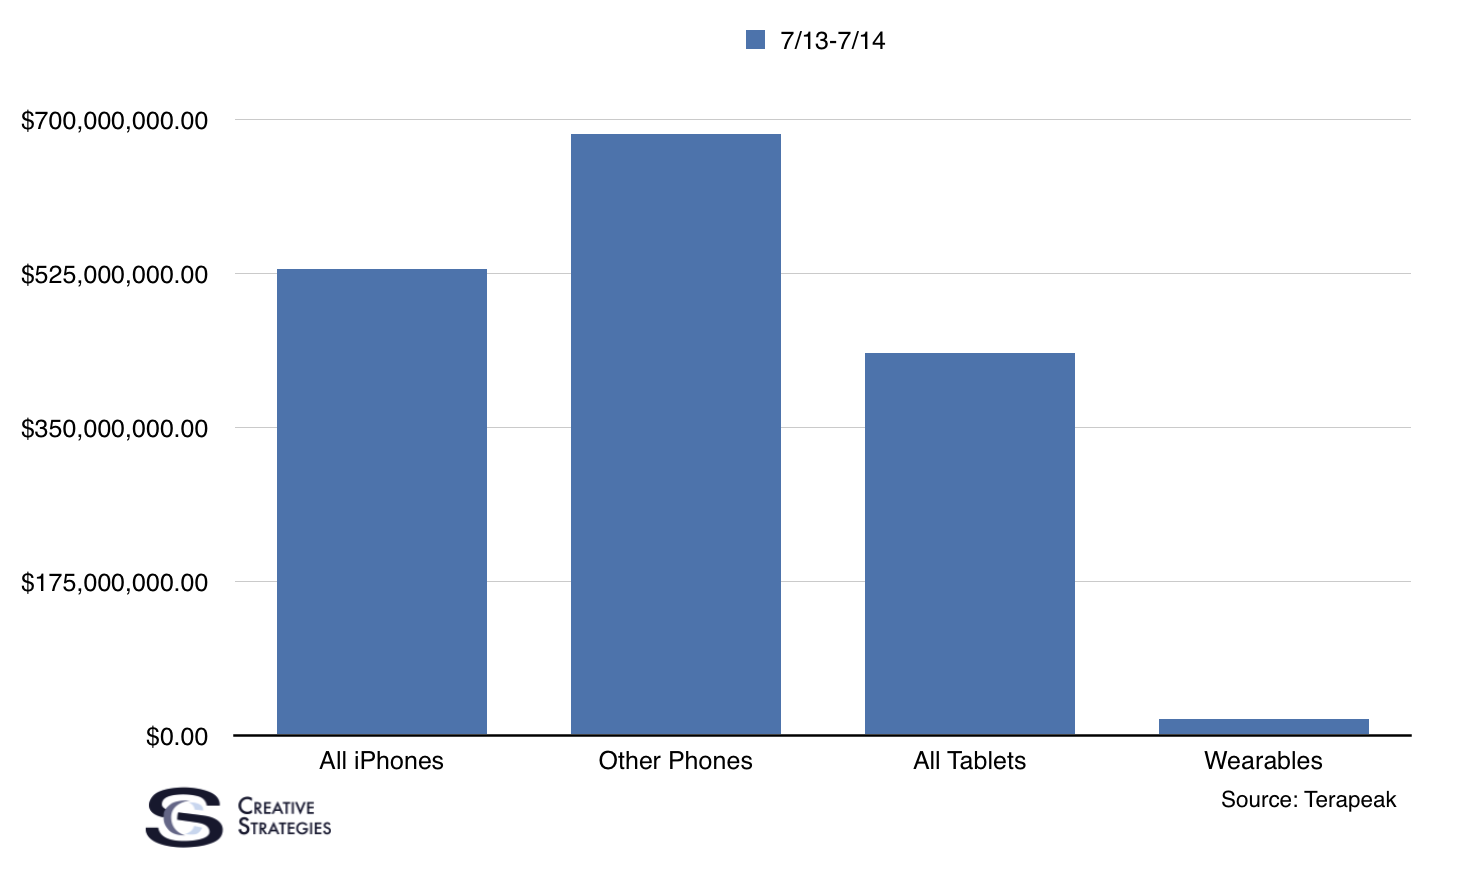
Apparently, selling iPhones on eBay is a half a billion dollar per year enterprise.
Given Jan’s article, and what many others on this forum have shared about the challenge facing wearables, what observations stand out to you with these charts?